We are excited to officially share some major news with our community: EssayHumanizer.io has officially rebranded and moved to HumanizeAI.co. As of today, all our services, technology, and specialized models are now hosted on our new, more powerful domain. While our look has changed, our mission remains the same: ensuring that your writing—no matter the purpose—always stays human, authentic, and undetectable.
Here is a quick breakdown of why we are making this move, how our technology has upgraded, and what to expect next.
Why We Are Growing Beyond “Essays”
When we first launched, our goal was simple: help students and academics refine their essays. But we quickly outgrew that initial idea.
Our platform was rapidly adopted by a much broader audience, including:
Content Marketers scaling their blogs.
Copywriters refining their ad copy.
Professionals humanizing everyday business emails.
Creators drafting scripts and stories.
We are moving to HumanizeAI.co to better represent this diverse community and the expanded, versatile capabilities of our technology.
To Our Academic Users: A More Powerful Experience
If you rely on us specifically for academic writing, you might be wondering if this broader focus leaves you behind. Absolutely not. In fact, our system is now more powerful than ever for your specific needs.
Under the hood, we have completely upgraded our architecture and built two distinct processing engines:
The Academic Engine: Tailored strictly for essays, papers, and rigorous academic standards.
The General Engine: Optimized for non-academic content like blogs, emails, and marketing copy.
How it works: You do not need to click any extra buttons. Whenever you paste your text, our system automatically detects the style and context. If it identifies an essay, it instantly routes your text through our dynamic academic models. Both engines are trained on millions of real academic and non-academic writings, ensuring your content remains completely undetectable and highly readable, no matter what you are working on.
What’s New?
We are keeping this transition completely seamless. Only two things are different:
The Domain Name: We are now hosted entirely at HumanizeAI.co. All old links and bookmarks for essayhumanizer.io will automatically redirect you.
The Logo: You will spot a refreshed logo at the top of your screen to match our new identity.
What Stays Exactly the Same?
Everything that makes the tool fast and effective remains exactly the same.
The Minimalist Interface: We kept the exact same distraction-free, workflow-first design. No new learning curves, no clutter—just immediate results.
The Look and Feel: Our brand colors, typography, and styling are completely untouched.
Your Account Access: All active subscriptions, login credentials, and plan details will transfer over seamlessly.
A Huge Thank You to Our Community
We want to close this announcement with a massive thank you. We are truly overwhelmed by the love and support we have received from this community.
When we built the initial tool, we never anticipated this level of adoption. You have exceeded our wildest expectations, and your feedback continues to drive every single improvement we make.
Thank you for continuing to trust us with your workflow. Head over to HumanizeAI.co to check out the new look!
If your goal is to become a billionaire, one question matters more than most:
Where should you study and what should you study?
While success is never guaranteed, the paths taken by today’s billionaires reveal clear patterns. Certain universities appear again and again. Certain degrees dominate. And a small number of countries consistently produce a disproportionate share of the world’s wealthiest individuals.
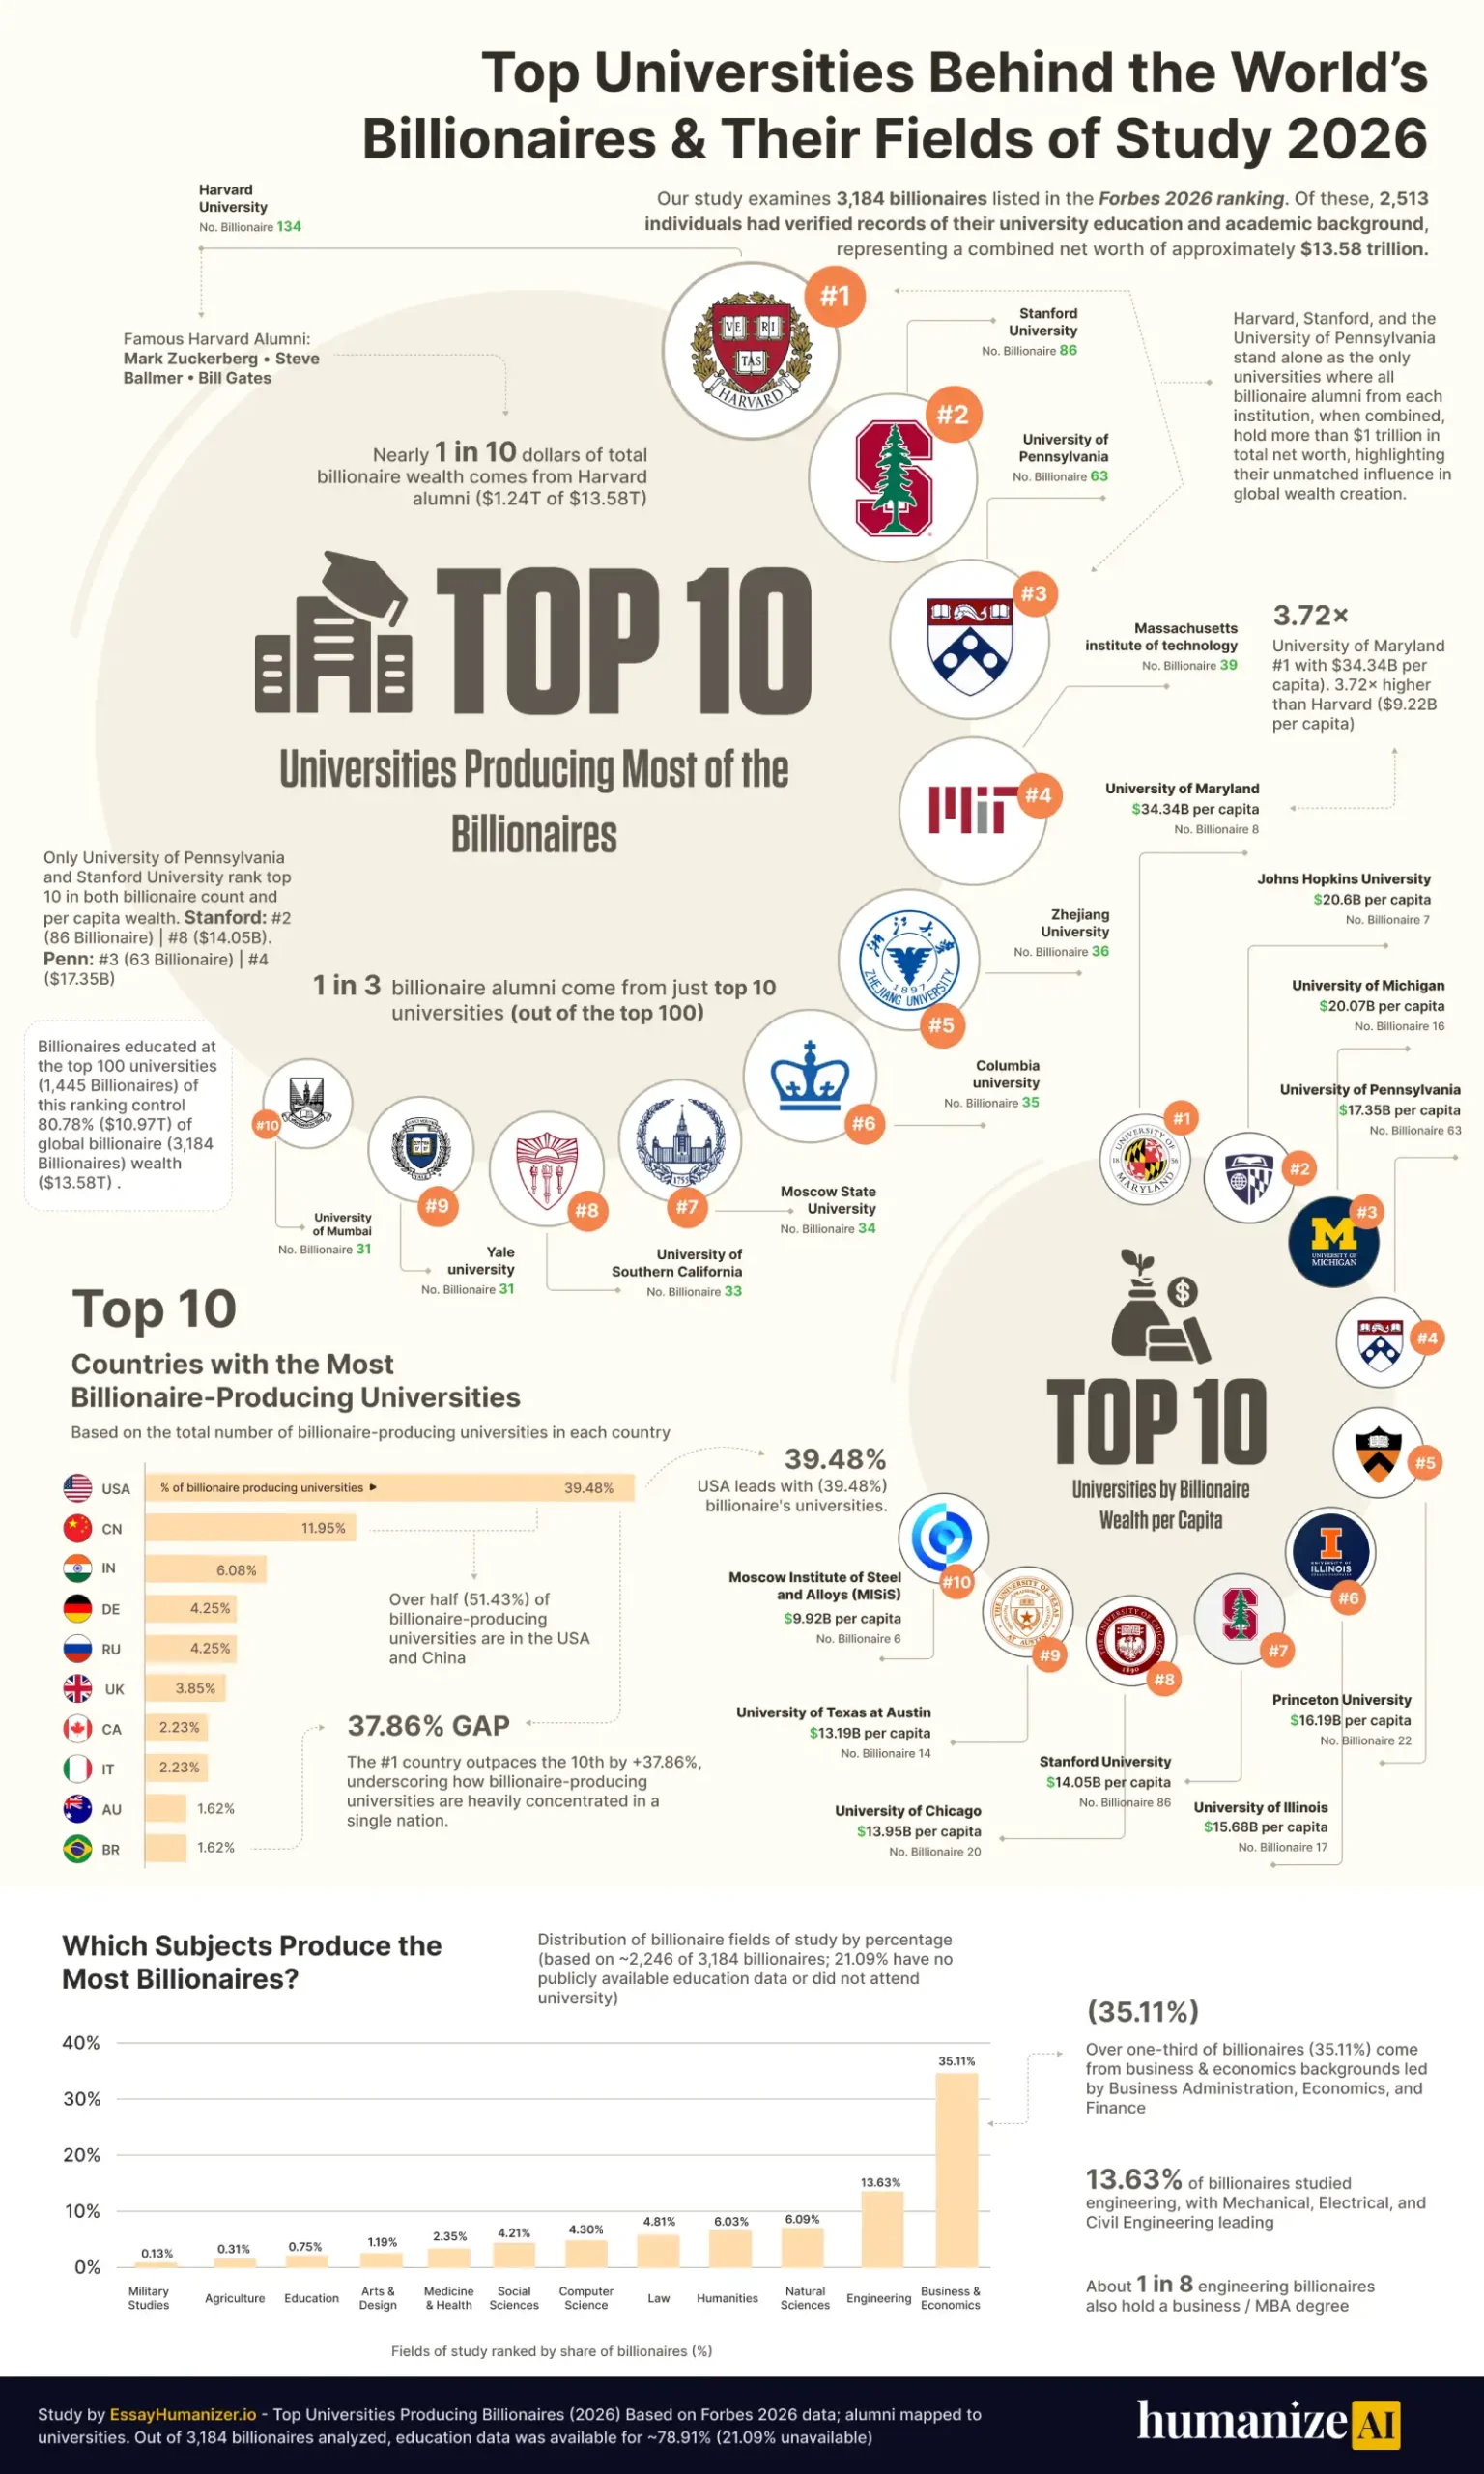
This 2026 study by HumanizeAI analyzes 3,184 billionaires based on Forbes 2026 data (analyzed through March 2026), mapping where they studied and what they studied. Education records were identified for 78.91% of individuals, while 21.09% had incomplete or unavailable data.
The results are striking.
Nearly half of all billionaires (45.38%) come from just 100 universities. A small group of institutions acts as a repeat pipeline for extreme wealth, while others produce fewer but significantly richer individuals.
But this study is not just about rankings.
It’s about understanding the patterns behind success.
In this report, we break down the following:
which universities consistently produce billionaire-level outcomes
what subjects are most commonly studied by billionaires
which countries are home to the universities that produce the most billionaires
which universities produce billionaires with the highest average net wealth
and how education, geography, and industry combine to shape extreme wealth
If you’ve ever wondered whether your choice of university, degree, or country could influence your chances of building extraordinary wealth, this data offers one of the clearest insights available today.
Quick Navigation:
Before we dive into the data, here’s a quick way to navigate the study.
You can jump to any section based on what you’re most interested in:
If you’re exploring this as a student, you may want to start with subjects. If you’re looking at strategy, the cross-analysis and rankings will be more useful.
A quick snapshot of the data
Metric
Value
Number of Billionaires Analyzed
3,184
Billionaires with Known Field of Study
2,513 (78.91%)
Unknown / Did Not Complete Study / Data Unavailable
671 (21.09%)
Total Net Worth of All Billionaires
$13.58 Trillion
Billionaires from Top 100 Universities
1,445 (45.38%)
Key Findings:
The data does more than highlight where billionaires studied, it reveals clear patterns about what paths tend to lead to extreme wealth.
While there is no guaranteed formula, some signals appear consistently across the dataset.
1. Billionaire Pathways Are Highly Concentrated: This study shows that billionaire creation is highly concentrated within a small group of universities. Out of 3,184 billionaires analyzed, 45.38% of all billionaires come from just top 100 institutions.
2. Even Among Top Universities, a Few Dominate Within this top 100 group, The top 10 universities account for 35.99% of billionaire alumni within the top 100 ranking. In other words, 1 in every 3 billionaire alumni in this group comes from just 10 universities.
3. 1 in every 10 dollars of billionaire wealth is linked to Harvard alumni: At the institutional level, Harvard University leads with 134 billionaire alumni, the highest in the dataset. It also represents a major share of global wealth, with alumni holding $1.235T, which is 9.09% of total billionaire wealth. This means nearly 1 in every 10 dollars of billionaire wealth is linked to Harvard alumni.
4. University of Maryland Leads Per Capita Wealth, 3.72× Higher Than Harvard: The University of Maryland ranks 1st in average wealth per billionaire at $34.34B, despite having only 8 billionaire alumni. In comparison, Harvard’s average stands at $9.22B, making Maryland’s per capita wealth 3.72x higher.
5. Only 3 Universities Have Alumni Wealth Exceeding $1 Trillion: Trillion-dollar club: Only three universities have alumni wealth exceeding $1 trillion combined. Harvard University, Stanford University, and the University of Pennsylvania form this exclusive group, operating at a scale no other institution reaches.
6. The U.S. and China Dominate the Global Billionaire Education Pipeline: The United States and China together account for 51.43% of billionaire-producing universities. This means more than half of the institutions in this ecosystem is concentrated in just two countries.
7. Business and Economics Are the Primary Pathways to Wealth: Business and economics are the most common fields of study, accounting for 35.11% of billionaires. A large portion comes from business administration and finance backgrounds, making it the dominant path. Engineering follows at 13.63%, while Computer Science accounts for just 4.30%.
8. Combining Engineering with Business Education Is a Common Winning Formula: About 1 in 8 engineering billionaires also pursued a business or MBA degree. This suggests that combining technical knowledge with business skills is a common path.
9. Top 100 Universities Control the Vast Majority of Global Billionaire Wealth: Billionaires educated at the top 100 universities (1,445 billionaires) of this ranking control 80.78% ($10.97T) of global billionaire (3,184 billionaires) wealth ($13.58T).
10. Only Two Universities Balance Both Scale and Per Capita Wealth: Only the University of Pennsylvania and Stanford University rank in the top 10 for both billionaire count and per capita wealth, making them uniquely balanced institutions; Pennsylvania ranks 3rd with 63 billionaires and 4th with $17.35B per capita, while Stanford ranks 2nd with 86 billionaires and 8th with $14.05B per capita, showing they combine both scale and high individual wealth.
11. Billionaire-Producing Universities of the USA Are Concentrated in Just 10 U.S. States: The top 10 U.S. states accounting for 67.65% of all billionaire-producing universities in the USA, showing that opportunity clusters in specific regions.
12. Nearly 1 in 6 Billionaire-Producing Universities Are Located in California: California leads by a wide margin, with 22 universities (16.06%), meaning nearly 1 in every 6 billionaire-producing institutions in the U.S. is located in a single state.
Ranking Top 100 Universities Producing Most of the Billionaires in the World 2026
Comprehensive analysis of universities and their billionaire alumni
No universities found matching your search criteria
Scroll to see more
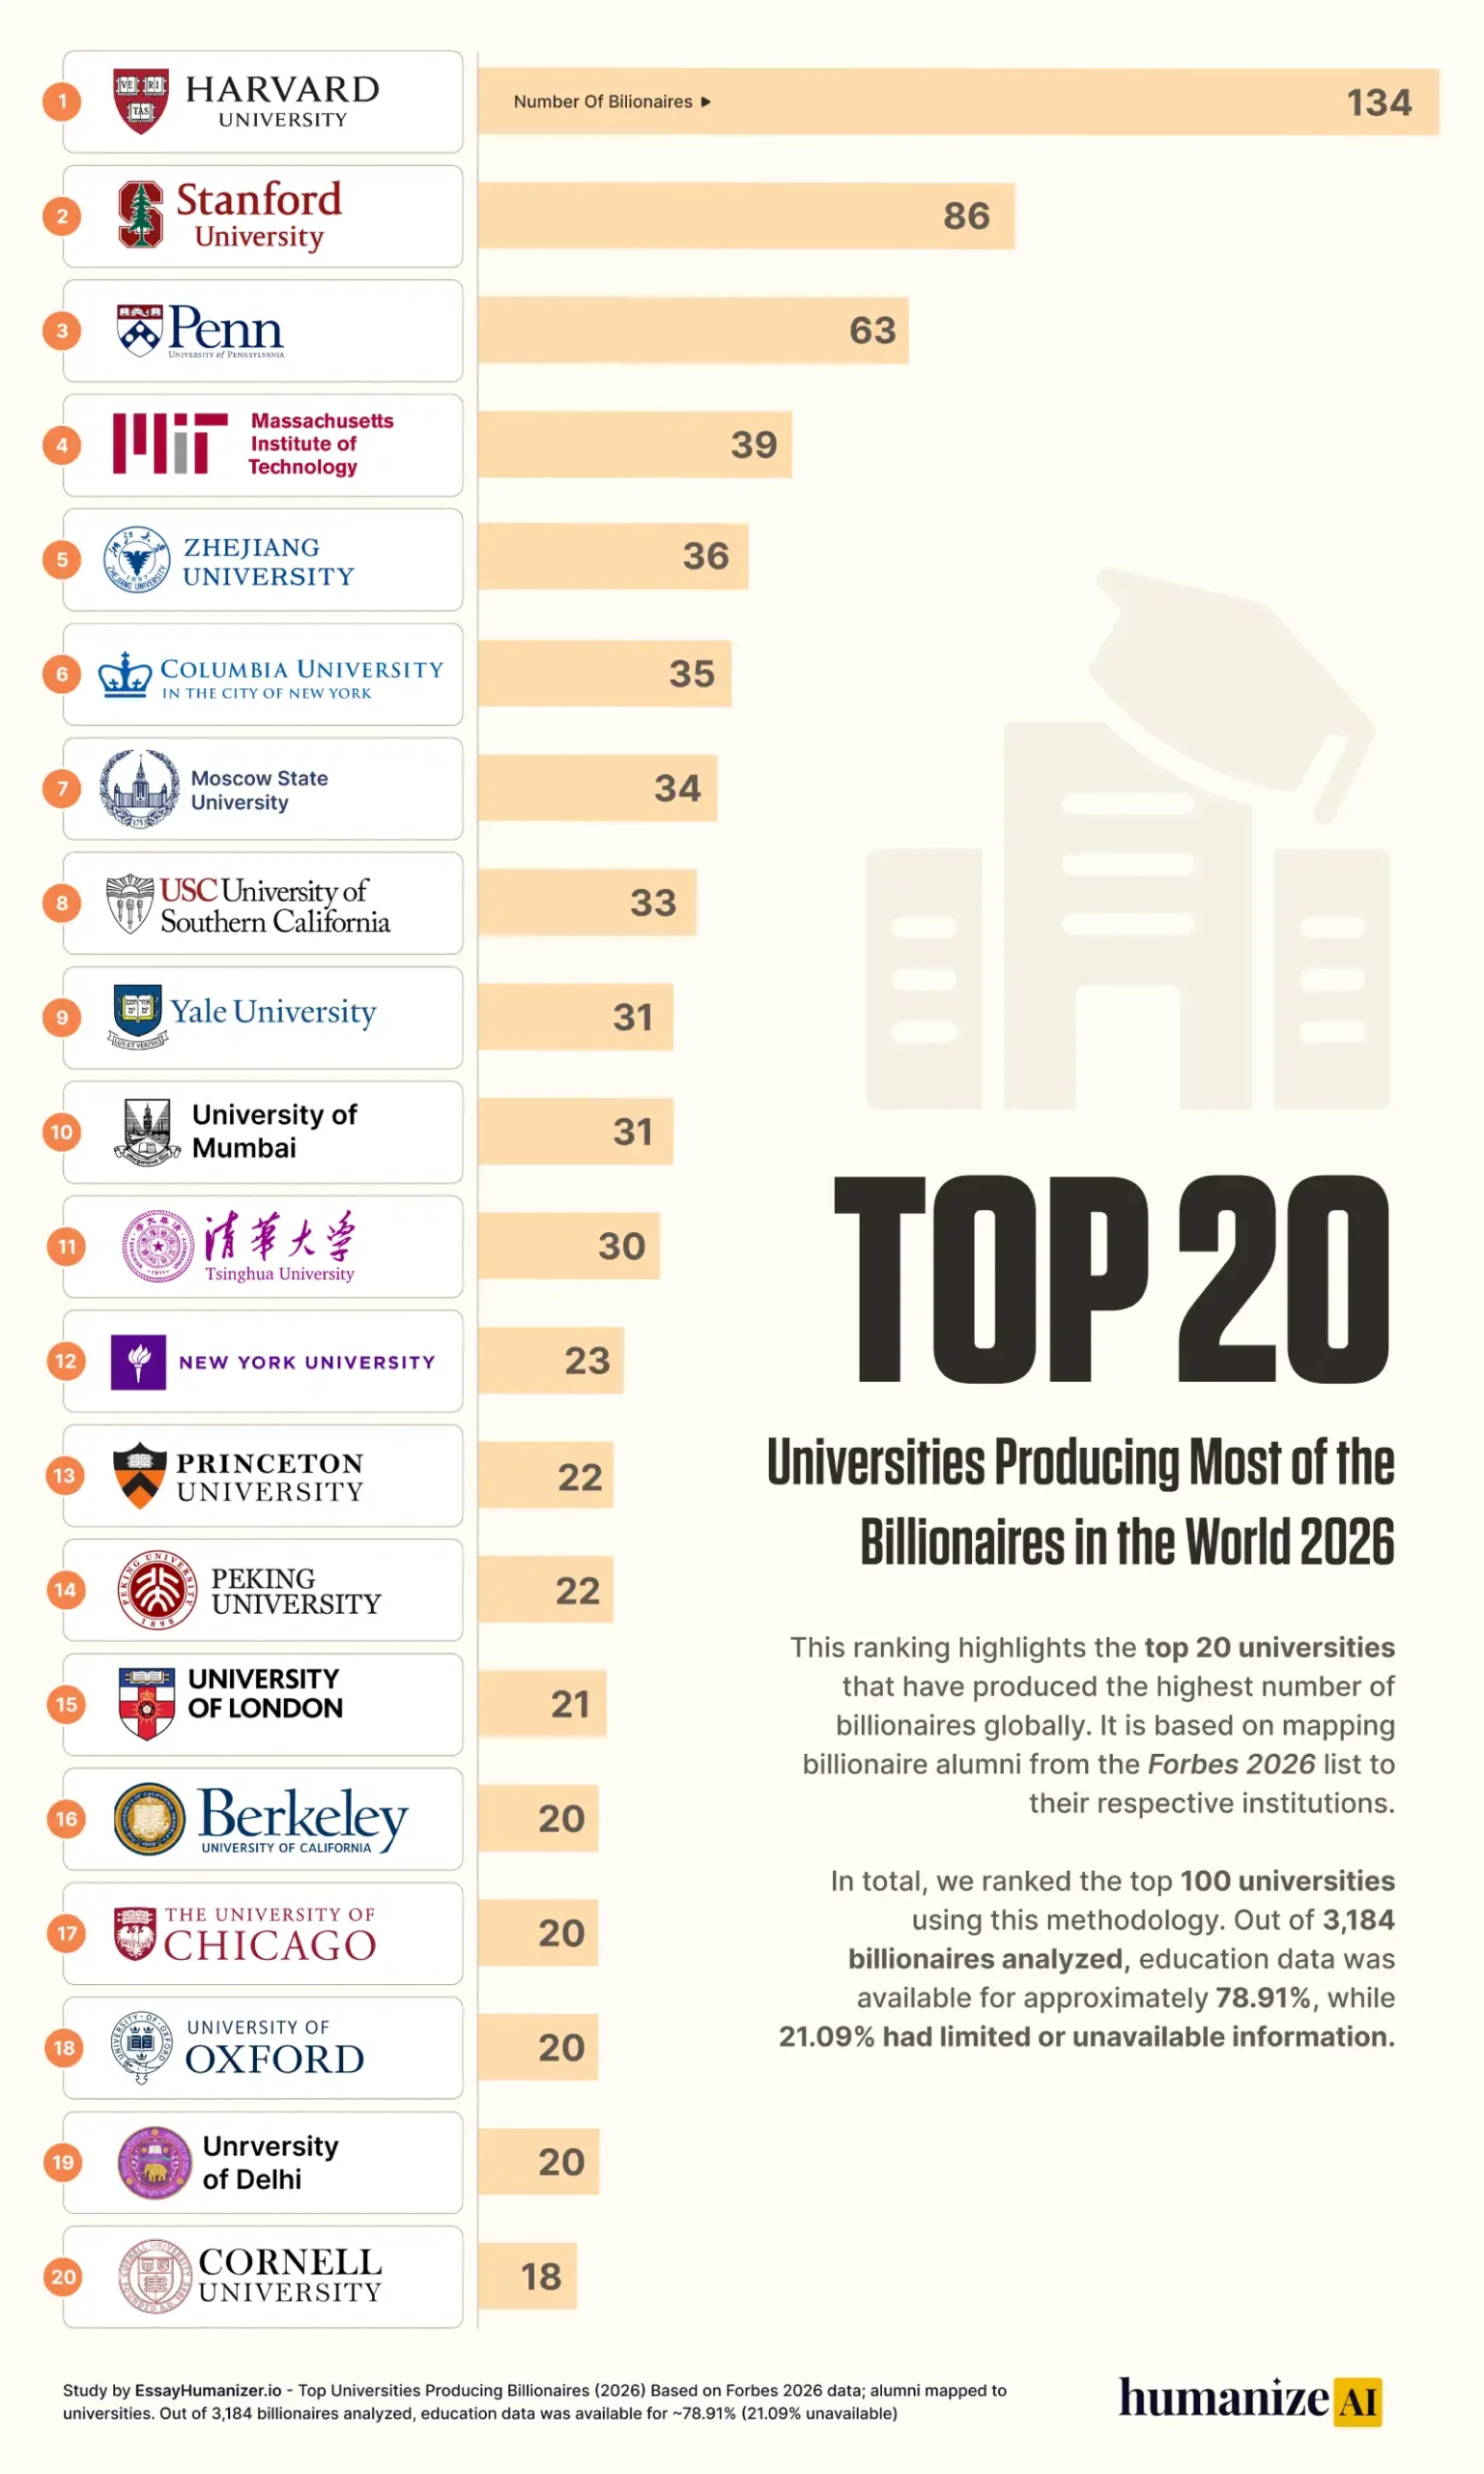
Top 20 Universities Producing Most of the Billionaires
This section shows where billionaire creation is most concentrated and where many high-growth journeys begin.
Although the full ranking covers 100 universities, a large share of the 1,445 billionaire alumni come from just these top 20 institutions. What sets them apart is not only scale, but also the type of outcomes they produce, from high-volume billionaire pipelines to smaller groups with much higher average wealth.
For students, these universities represent different paths: strong networks, high-value outcomes, or rare ecosystems that deliver both. The breakdown below looks at billionaire share, total wealth, and wealth per capita to show which environment best matches the path you want to take.
1. Harvard University
Country: United States
Number of Billionaires: 134
Percentage of Billionaires from the Top 100 Universities: 9.27%
Total Net Worth: $1.235T
Net Worth Per Capita: $9.22B
Global Billionaire Wealth Share: 9.09%
Notable Alumni: Mark Zuckerberg, Bill Gates, Steve Ballmer
Harvard University stands at the center of global wealth creation, producing more billionaire alumni than any other institution.
With 134 billionaires, it accounts for 9.27% of all billionaire alumni within the top 100 universities. Its alumni collectively hold $1.235 trillion, meaning nearly 1 in every 10 dollars of global billionaire wealth is linked to this single institution.
What defines Harvard is scale.
It consistently produces a large number of billionaires across industries, rather than concentrating wealth in a small group.
This is reflected in its alumni. Figures like Mark Zuckerberg (Facebook), Bill Gates (Microsoft), and Steve Ballmer (Microsoft) highlight strong links to both technology innovation and large-scale business leadership.
However, Harvard does not lead in wealth per individual. Its $9.22B average is lower than several universities that produce fewer but significantly richer individuals.
This highlights a key insight.
Harvard maximizes exposure and probability.
For students, this means access to one of the strongest networks, ecosystems, and opportunity pipelines in the world. It increases your chances of entering high-growth industries, building connections, and positioning yourself in environments where large-scale wealth is more likely to emerge.
Another defining trait is consistency. Harvard has produced billionaires across multiple economic eras, from industrial wealth to modern tech-driven fortunes, making it one of the most stable pipelines of wealth creation globally.
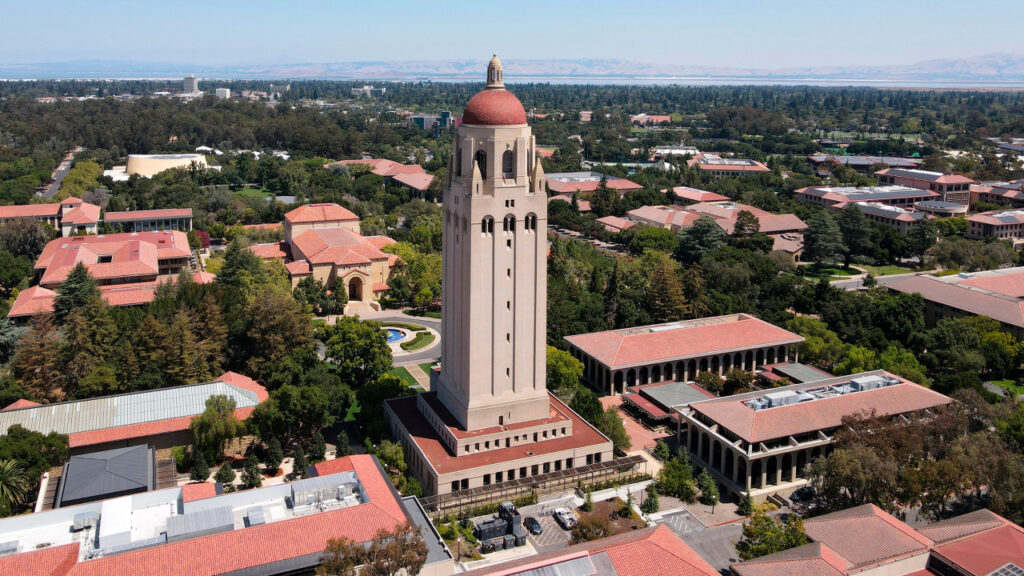
2. Stanford University
Country: United States
Number of Billionaires: 86
Percentage of Billionaires from the Top 100 Universities: 5.95%
Total Net Worth: $1.208T
Net Worth Per Capita: $14.05B
Global Billionaire Wealth Share: 8.90%
Notable Alumni: Larry Page, Sergey Brin, Jensen Huang
Stanford University ranks second, but its model of wealth creation is very different from Harvard’s.
With 86 billionaire alumni, it produces fewer billionaires than Harvard. However, the scale of impact is significantly larger per individual.
Its alumni collectively hold $1.208 trillion, placing it just behind Harvard in total wealth. But with an average of $14.05B per billionaire, Stanford outperforms Harvard in wealth per person, showing a stronger concentration of high-value outcomes.
What defines Stanford is its deep connection to the technology ecosystem.
Located in Silicon Valley, it sits at the center of the world’s most powerful startup and innovation network. This is clearly reflected in its alumni. Figures like Larry Page and Sergey Brin (Google), along with Jensen Huang (NVIDIA), highlight its strong link to high-impact, scalable technology companies.
Stanford is one of the few universities that balances both scale and wealth. It ranks among the top institutions for both billionaire count and per capita wealth, making it one of the most efficient wealth-producing environments.
For students, this represents a different path.
Stanford is not about maximizing the number of outcomes. It is about maximizing impact.
It places you in an ecosystem where innovation, startups, and high-growth companies dominate. This increases the likelihood of building or joining ventures that scale globally and generate significantly larger individual wealth.
Another defining trait is focus. Unlike Harvard, which spans multiple industries, Stanford’s strength is concentrated in technology and innovation, where the potential for rapid and large-scale wealth creation is highest.
3. University of Pennsylvania
Country: United States
Number of Billionaires: 63
Percentage of Billionaires from the Top 100 Universities: 4.36%
Total Net Worth: $1.093T
Net Worth Per Capita: $17.35B
Global Billionaire Wealth Share: 8.05%
Notable Alumni: Elon Musk, Steve Cohen, Laurene Powell Jobs
The University of Pennsylvania ranks third and represents one of the most powerful wealth-building environments in the world.
With 63 billionaire alumni, it produces fewer individuals than Harvard and Stanford. However, its strength lies in the value of those outcomes.
Penn’s alumni hold a combined $1.093 trillion, with an average of $17.35B per billionaire, making it one of the highest-performing universities in terms of wealth per individual.
This is reflected in its alumni. Figures like Elon Musk (Tesla, SpaceX), Steve Cohen (hedge funds), and Laurene Powell Jobs (Apple, investments) highlight a strong mix of technology, finance, and large-scale ownership.
What defines Penn is its capital-driven wealth model.
Unlike Stanford’s focus on innovation or Harvard’s scale, Penn’s ecosystem is deeply tied to finance, investment, and ownership. Many of its billionaires are connected to private equity, hedge funds, and major capital allocation strategies, where wealth is built through control, investment, and long-term value creation.
For students, this represents a different path.
Penn is about positioning yourself close to the capital.
It offers access to one of the strongest finance and business ecosystems in the world, where understanding markets, ownership, and strategic investments can lead to significantly higher individual wealth outcomes.
Another defining trait is balance. Penn is one of the few universities that ranks highly in both billionaire count and per capita wealth, making it one of the most efficient and well-rounded wealth-producing institutions globally.
4. Massachusetts Institute of Technology
Country: United States
Number of Billionaires: 39
Percentage of Billionaires from the Top 100 Universities: 2.70%
Total Net Worth: $231.7B
Net Worth Per Capita: $5.94B
Global Billionaire Wealth Share: 1.71%
Notable Alumni: Philippe Laffont, Tony Tamer, Hubertus von Baumbach
The Massachusetts Institute of Technology ranks fourth and represents a very different path to billionaire-level success.
With 39 billionaire alumni, MIT produces fewer billionaires than the top three universities. Its total wealth of $231.7B and average of $5.94B per individual are also lower in comparison.
But what makes MIT unique is not scale or capital.
It is technical depth.
MIT’s billionaire output is closely tied to engineering, science, and innovation-driven industries. Unlike Harvard or Penn, where networks and capital play a central role, MIT’s path is built on expertise, problem-solving, and technological breakthroughs.
This is reflected in its alumni. Figures like Philippe Laffont (investment and technology), Tony Tamer (consumer and tech businesses), and Hubertus von Baumbach (healthcare and pharmaceuticals) highlight a mix of deep-tech, industrial, and research-driven sectors.
What defines MIT is an engineering-driven wealth model.
Many of its billionaires are involved in industries such as advanced technology, healthcare, engineering, and scientific innovation. These sectors often require longer development cycles and deeper technical knowledge, which can limit speed but create strong long-term value.
For students, this represents a very different strategy.
MIT is not about quick wins or access to capital. It is about building rare skills.
It positions you in environments where technical expertise becomes the foundation of wealth, especially in industries where innovation, patents, and scientific advancement drive long-term growth.
Another defining trait is depth over scale. MIT produces fewer billionaires, but many are involved in highly complex, high-impact industries that shape the future of technology and science.
5. Zhejiang University
Country: China
Number of Billionaires: 36
Percentage of Billionaires from the Top 100 Universities: 2.49%
Total Net Worth: $152.3B
Net Worth Per Capita: $4.23B
Global Billionaire Wealth Share: 1.12%
Notable Alumni: Colin Huang, Liang Wenfeng, Yi Zheng
Zhejiang University ranks fifth and represents one of the fastest-growing wealth creation ecosystems in the world.
With 36 billionaire alumni, it is the highest-ranked university from China in this study. While its total wealth and per capita figures are lower than the top U.S. institutions, its strength lies in speed and growth.
Zhejiang’s billionaire output is closely tied to China’s digital economy. Many of its alumni are connected to e-commerce, fintech, and platform-based businesses that scale rapidly.
This is reflected in its alumni. Figures like Colin Huang (PDD Holdings), along with Liang Wenfeng and Yi Zheng, highlight strong links to high-growth, technology-driven industries.
What defines Zhejiang is a growth-driven wealth model.
Unlike Harvard or Penn, where wealth is built through networks or capital, Zhejiang reflects an environment where rapid execution, market scale, and digital adoption drive outcomes.
Another defining factor is timing.
Many Zhejiang alumni have built fortunes in relatively short periods, driven by China’s expanding consumer base and fast-moving technology markets.
For students, this represents a very different strategy.
Zhejiang is not about legacy networks or long-established financial systems. It is about entering a high-growth environment where speed, adaptability, and market understanding can create opportunities much faster.
This positions Zhejiang University as a modern wealth engine, reflecting how emerging markets and digital ecosystems are reshaping how billionaire wealth is created today.
6. Columbia University
Country: United States
Number of Billionaires: 35
Percentage of Billionaires from the Top 100 Universities: 2.42%
Total Net Worth: $327.7B
Net Worth Per Capita: $9.36B
Global Billionaire Wealth Share: 2.41%
Notable Alumni: Warren Buffett, Len Blavatnik, Brad Jacobs
Columbia University ranks sixth and stands out as one of the strongest gateways to global capital markets.
With 35 billionaire alumni, it maintains a steady position among the top billionaire-producing universities. Its alumni collectively hold $327.7B, with an average of $9.36B per billionaire, placing it close to Harvard in terms of per capita wealth.
What defines Columbia is location.
Based in New York City, it sits at the center of the world’s largest financial ecosystem. This proximity shapes the type of wealth its alumni create.
This is reflected in its alumni. Figures like Warren Buffett (investments), Len Blavatnik (diversified industries), and Brad Jacobs (logistics and large-scale business operations) highlight strong connections to capital allocation, acquisitions, and global business expansion.
Unlike Penn, which is deeply structured around finance education, Columbia operates through access.
It places students directly inside the financial system, where exposure to Wall Street, investment firms, and global markets becomes part of the learning environment.
What defines Columbia is a market-access-driven wealth model.
Many of its billionaires build wealth by operating within existing financial systems, leveraging networks, capital flows, and strategic deal-making rather than building from scratch.
For students, this represents a very specific advantage.
Columbia is about proximity.
It gives you direct access to one of the most powerful financial hubs in the world, where opportunities, internships, and connections are often just steps away from campus.
Another defining trait is versatility. While finance dominates, Columbia’s ecosystem also supports diversified industries, allowing students to move between investment, operations, and global business roles.
This positions Columbia University as a capital access hub, where being close to the market can be just as powerful as building within it.
7. Moscow State University
Country: Russia
Number of Billionaires: 34
Percentage of Billionaires from the Top 100 Universities: 2.35%
Total Net Worth: $124.3B
Net Worth Per Capita: $3.66B
Global Billionaire Wealth Share: 0.92%
Notable Alumni: Alexander Gerko, Viktor Vekselberg, Yuri Milner
Moscow State University ranks seventh and represents a very different model of wealth creation compared to Western institutions.
With 34 billionaire alumni, it maintains a strong presence in terms of volume. However, its total wealth of $124.3B and average of $3.66B per billionaire are lower than most top U.S. universities.
What defines Moscow State is its connection to resource-driven and industrial economies.
Its billionaire output is heavily tied to sectors such as natural resources, metals, energy, and large-scale industrial operations. Unlike Stanford or MIT, where wealth is driven by innovation, or Penn and Columbia, where capital plays a central role, Moscow State reflects a system where ownership of physical assets drives wealth.
This is reflected in its alumni. Figures like Alexander Gerko (trading), Viktor Vekselberg (energy and metals), and Yuri Milner (investments and technology) highlight a mix of commodities, finance, and strategic investments.
What defines Moscow State is a resource-driven wealth model.
Many of its billionaires have built their fortunes through control of infrastructure, raw materials, and large industrial enterprises. These industries often generate significant wealth but are less scalable compared to technology or digital platforms.
For students, this represents a very different path.
Moscow State is not about startups or rapid scaling. It is about entering industries where ownership, control, and long-term asset value play a central role in wealth creation.
This path is often shaped by regional economic structures, where access to resources and industrial systems defines opportunity more than innovation or capital markets.
Another defining trait is concentration. Wealth is often tied to specific sectors rather than diversified across industries, making outcomes more dependent on economic cycles and regional factors.
This positions Moscow State University as a resource-based wealth pipeline, offering a clear example of how geography and industry structure shape billionaire outcomes.
8. University of Southern California
Country: United States
Number of Billionaires: 33
Percentage of Billionaires from the Top 100 Universities: 2.28%
Total Net Worth: $138.0B
Net Worth Per Capita: $4.18B
Global Billionaire Wealth Share: 1.02%
Notable Alumni: Ivan Glasenberg, Cho Jung-ho, Tamara Gustavson
The University of Southern California ranks eighth and stands out for its diversified approach to wealth creation.
With 33 billionaire alumni, it maintains a strong position among top universities. Its total wealth of $138.0B and average of $4.18B per billionaire place it in the mid-range compared to other top institutions.
What defines USC is diversity across industries.
Unlike Stanford, which is heavily focused on technology, or Penn, which leans toward finance, USC’s billionaire output spans multiple sectors, including real estate, entertainment, global trade, and investments.
This is reflected in its alumni. Figures like Ivan Glasenberg (commodities and global trade), Cho Jung-ho (logistics and transportation), and Tamara Gustavson (real estate) highlight a wide range of industries rather than a single dominant pathway.
Another defining factor is location.
Based in Los Angeles, USC benefits from proximity to major industries such as entertainment, international trade, and real estate. This environment naturally creates opportunities across multiple sectors rather than concentrating wealth in one area.
What defines USC is a diversified, location-driven wealth model.
Instead of specializing in a single path, it provides access to a broad set of industries where wealth can be built through different routes.
For students, this represents flexibility.
USC is not about choosing one clear path, like technology or finance. It is about exposure to multiple industries, allowing you to explore different opportunities and adapt based on where you see the most potential.
Another defining trait is adaptability. Many USC-linked billionaires operate across industries, combining real estate, trade, and investments rather than focusing on a single domain.
This positions the University of Southern California as a multi-industry wealth hub, where location and diversity create multiple pathways to success.
9. Yale University
Country: United States
Number of Billionaires: 31
Percentage of Billionaires from the Top 100 Universities: 2.15%
Total Net Worth: $214.6B
Net Worth Per Capita: $6.92B
Global Billionaire Wealth Share: 1.58%
Notable Alumni: Stephen Schwarzman, Joseph Tsai, John Mars
Yale University ranks ninth and represents a more strategic and long-term approach to wealth creation.
With 31 billionaire alumni, it maintains a strong presence among top universities. Its alumni collectively hold $214.6B, with an average of $6.92B per billionaire, showing a balanced combination of scale and value.
What defines Yale is its connection to long-term capital and investment strategy.
Unlike Columbia, which is driven by market access, or Penn, which focuses on finance and ownership structures, Yale’s strength lies in how capital is managed over time. Many of its billionaires are closely linked to private equity, asset management, and large investment firms.
This is reflected in its alumni. Figures like Stephen Schwarzman (private equity), Joseph Tsai (technology and investments), and John Mars (global business and legacy wealth) highlight a strong presence in strategic capital growth rather than rapid scaling.
What defines Yale is a long-term capital-driven wealth model.
Wealth is often built through disciplined investment strategies, ownership in large companies, and long-term value creation rather than fast-moving startups or short-term opportunities.
For students, this represents a very specific path.
Yale is not about speed or immediate scale. It is about thinking long-term.
It positions you in environments where understanding capital allocation, investment strategy, and global markets can lead to sustained and significant wealth over time.
Another defining trait is stability. Many Yale-linked fortunes are built through long-term strategies that grow steadily, rather than rapidly, making outcomes more consistent across economic cycles.
This positions Yale University as a strategic investment hub, where patience, capital discipline, and long-term thinking define success.
10. University of Mumbai
Country: India
Number of Billionaires: 31
Percentage of Billionaires from the Top 100 Universities: 2.15%
The University of Mumbai ranks tenth and represents one of the strongest wealth creation models outside the United States and China.
With 31 billionaire alumni, it matches Yale in volume but follows a very different path. Its alumni collectively hold $232.6B, with an average of $7.50B per billionaire, placing it above many institutions in this range in terms of per capita wealth.
What defines Mumbai is ownership.
Its billionaire output is heavily tied to family-led conglomerates and founder-controlled businesses across industries such as energy, retail, telecom, and manufacturing.
This is reflected in its alumni. Figures like Mukesh Ambani (Reliance Industries), Kumar Birla (Aditya Birla Group), and Radhakishan Damani (DMart) highlight large-scale business empires built through long-term ownership and expansion.
What defines Mumbai is a conglomerate-driven wealth model.
Unlike Stanford’s startup ecosystem or Columbia’s financial markets, wealth here is often built through controlling diversified businesses that operate across multiple industries over decades.
Another defining factor is market scale.
India’s massive and growing consumer base creates opportunities for businesses to expand rapidly across sectors, especially when backed by strong ownership structures.
For students, this represents a very specific path.
Mumbai is not about quick exits or venture-backed growth. It is about building and controlling businesses over the long term.
It positions you in an environment where understanding operations, market expansion, and ownership can lead to significant wealth accumulation.
Another defining trait is continuity. Many Mumbai-linked billionaires are connected to legacy businesses that evolve over time, combining traditional industries with modern growth strategies.
This positions the University of Mumbai as a long-term ownership hub, where scale, control, and diversification drive billionaire outcomes.
11. Tsinghua University
Country: China
Number of Billionaires: 30
Percentage of Billionaires from the Top 100 Universities: 2.08%
Total Net Worth: $110.9B
Net Worth Per Capita: $3.70B
Global Billionaire Wealth Share: 0.82%
Notable Alumni: Wang Xing, Xu Hang, Wang Ning
Tsinghua University ranks eleventh and represents one of the most structured and powerful wealth creation systems in China.
With 30 billionaire alumni, it continues China’s strong presence in the global billionaire education pipeline. However, its real strength is not just in numbers, but in how its ecosystem is built.
What defines Tsinghua is structure.
Unlike Zhejiang, which reflects fast-moving entrepreneurial growth, Tsinghua operates within a more organized system tied to large-scale industry, technology, and national economic priorities.
This is reflected in its alumni. Figures like Wang Xing (consumer technology), Xu Hang (healthcare technology), and Wang Ning (consumer brands) highlight strong connections to sectors that scale through domestic demand and industrial expansion.
What defines Tsinghua is a system-driven wealth model.
Many of its billionaires build wealth by operating within large, structured ecosystems such as manufacturing, infrastructure, and national-level technology platforms, rather than purely independent startup environments.
Another defining factor is domestic scale.
China’s massive internal market allows businesses to grow to a significant size without relying heavily on global expansion. This creates a different type of opportunity, where scale is achieved through depth in a single market.
For students, this represents a very specific path.
Tsinghua is not about rapid experimentation or global startup culture. It is about entering a system where growth is structured, supported, and often aligned with larger economic trends.
This positions you in environments where long-term expansion, operational scale, and industry alignment can lead to significant wealth creation.
Another defining trait is consistency. Many Tsinghua-linked billionaires grow within established systems, making outcomes more stable but often less explosive compared to high-risk startup ecosystems.
This positions Tsinghua University as a structured growth engine, where scale is achieved through system strength rather than speed alone.
12. New York University
Country: United States
Number of Billionaires: 23
Percentage of Billionaires from the Top 100 Universities: 1.59%
Total Net Worth: $189.1B
Net Worth Per Capita: $8.22B
Global Billionaire Wealth Share: 1.39%
Notable Alumni: Thomas Peterffy, Israel Englander, Ken Langone
New York University ranks twelfth and represents a highly practical, execution-driven path to wealth creation within global financial markets.
With 23 billionaire alumni, NYU has a smaller presence compared to top-ranked universities. However, its alumni collectively hold $189.1B, with an average of $8.22B per billionaire, placing it among the stronger performers in this range.
What defines NYU is execution.
Unlike Columbia, which provides access to financial systems, NYU is closely tied to operating within those systems. Its ecosystem is heavily connected to trading, asset management, private equity, and investment operations.
This is reflected in its alumni. Figures like Thomas Peterffy (trading and brokerage), Israel Englander (hedge funds), and Ken Langone (investments and retail) highlight a strong focus on building wealth through active participation in financial markets.
What defines NYU is an execution-driven finance model.
Many of its billionaires are not just connected to capital; they actively manage, trade, and deploy it at scale. Wealth is often built through strategy, decision-making, and direct involvement in financial operations.
Another defining factor is practicality.
NYU’s environment is closely aligned with real-world finance. Its proximity to New York’s financial ecosystem creates constant exposure to markets, deal-making, and investment activity.
For students, this represents a clear path.
NYU is not about theory or long-term positioning alone. It is about learning how to operate within capital markets and execute at a high level.
It places you in environments where skills like trading, investing, and financial strategy can directly translate into wealth creation.
Another defining trait is specialization. Compared to more diversified universities, NYU’s strength is concentrated in finance, making it a strong choice for students who want a focused, market-driven path.
This positions New York University as an execution hub, where wealth is built not just through access to capital, but through the ability to actively use it.
13. Princeton University
Country: United States
Number of Billionaires: 22
Percentage of Billionaires from the Top 100 Universities: 1.52%
Total Net Worth: $356.1B
Net Worth Per Capita: $16.19B
Global Billionaire Wealth Share: 2.62%
Notable Alumni: Jeff Bezos, Eric Schmidt, MacKenzie Scott
Princeton University ranks thirteenth, but its impact is far greater than its size suggests.
With only 22 billionaire alumni, it produces fewer billionaires than most top institutions. However, its alumni collectively hold $356.1B, with an average of $16.19B per billionaire, placing it among the highest in terms of wealth per individual.
What defines Princeton is concentration.
Unlike Harvard, which produces many billionaires, Princeton produces fewer, but significantly wealthier individuals.
This is reflected in its alumni. Figures like Jeff Bezos (Amazon), Eric Schmidt (Google), and MacKenzie Scott (Amazon) highlight strong connections to global-scale companies and high-value ownership.
What defines Princeton is a high-concentration wealth model.
Many of its billionaires are tied to companies or investments that operate at a massive global scale, which drives much higher individual net worth compared to more distributed wealth systems.
Another defining factor is influence.
Princeton alumni are often found in top leadership positions within major global companies, shaping outcomes at the highest level rather than participating at early-stage levels.
For students, this represents a very specific path.
Princeton is not about maximizing opportunities or exploring multiple industries. It is about positioning yourself for high-impact roles where the scale of outcomes is significantly larger.
It places you in environments where leadership, strategic decision-making, and ownership at the highest level can translate into extraordinary wealth.
Another defining trait is selectivity. The pathway is narrower, but the potential outcome per individual is significantly higher.
This positions Princeton University as a high-impact wealth institution, where fewer paths exist, but those paths can lead to exceptionally large outcomes.
14. Peking University
Country: China
Number of Billionaires: 22
Percentage of Billionaires from the Top 100 Universities: 1.52%
Total Net Worth: $132.7B
Net Worth Per Capita: $6.03B
Global Billionaire Wealth Share: 0.98%
Notable Alumni: Dang Yanbao, Wang Ning, Wang Liping
Peking University ranks fourteenth and represents a more traditional, industry-driven path to wealth in China.
With 22 billionaire alumni, it matches Princeton in volume but follows a very different model. Its alumni hold $132.7B in total wealth, with a moderate average of $6.03B per billionaire.
What defines Peking is industry.
Unlike Zhejiang’s fast-growth startups or Tsinghua’s structured tech ecosystem, Peking’s billionaire output is more closely tied to manufacturing, energy, and large-scale industrial sectors.
This is reflected in its alumni, many of whom are connected to infrastructure-heavy and production-driven businesses.
For students, this represents a different path.
Peking is not about rapid scaling or digital innovation. It is about building wealth through industries that grow steadily over time and operate at large scale.
This positions Peking University as an industrial wealth hub, where long-term expansion and core industries drive billionaire outcomes.
15. University of London
Country: United Kingdom
Number of Billionaires: 21
Percentage of Billionaires from the Top 100 Universities: 1.45%
Total Net Worth: $108.9B
Net Worth Per Capita: $5.19B
Global Billionaire Wealth Share: 0.80%
Notable Attendees: Eyal Ofer
The University of London ranks fifteenth and represents a globally connected path to wealth.
With 21 billionaire alumni and $108.9B in total wealth, it sits in the mid-range but stands out for its international reach.
What defines London is global exposure.
Its billionaire output is closely tied to international trade, real estate, and cross-border business. Many alumni operate across multiple countries rather than within a single domestic market.
This is reflected in its alumni, who are linked to global logistics, property, and diversified international businesses.
For students, this represents a clear advantage.
London places you in one of the world’s most international business hubs, where access to global markets, networks, and capital flows is built into the environment.
This positions the University of London as a global wealth gateway, where cross-border opportunities drive long-term success.
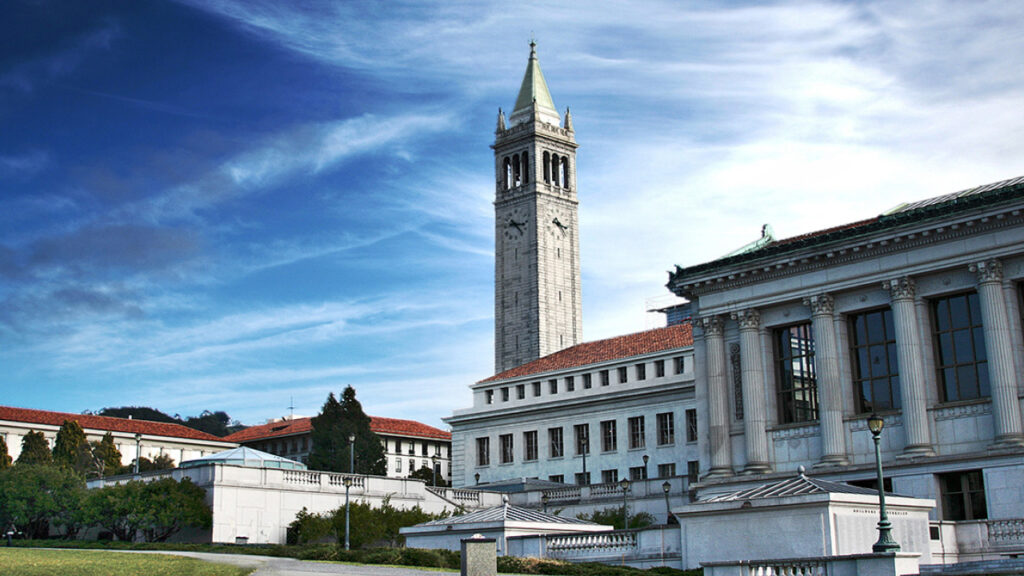
16. University of California, Berkeley
Country: United States
Number of Billionaires: 20
Percentage of Billionaires from the Top 100 Universities: 1.38%
Total Net Worth: $153.3B
Net Worth Per Capita: $7.67B
Global Billionaire Wealth Share: 1.13%
Notable Alumni: Masayoshi Son, Marilyn Simons, Adam Foroughi
The University of California, Berkeley, ranks sixteenth and represents a more open and accessible path into the technology and venture ecosystem.
With 20 billionaire alumni and $153.3B in total wealth, Berkeley performs strongly for its size, with a solid $7.67B average per billionaire.
What defines Berkeley is openness.
Unlike Stanford’s tightly networked ecosystem, Berkeley operates as a broader entry point into Silicon Valley, feeding talent into startups, venture capital, and tech companies at scale.
This is reflected in its alumni, who are strongly linked to venture capital, data-driven businesses, and high-growth technology companies.
For students, this represents a practical path.
Berkeley is not just about building startups; it is about entering the ecosystem. It gives access to opportunities across startups, VC firms, and tech companies without relying on elite networks alone.
This positions UC Berkeley as an open innovation hub, where access, skills, and proximity to Silicon Valley create multiple pathways into wealth creation.
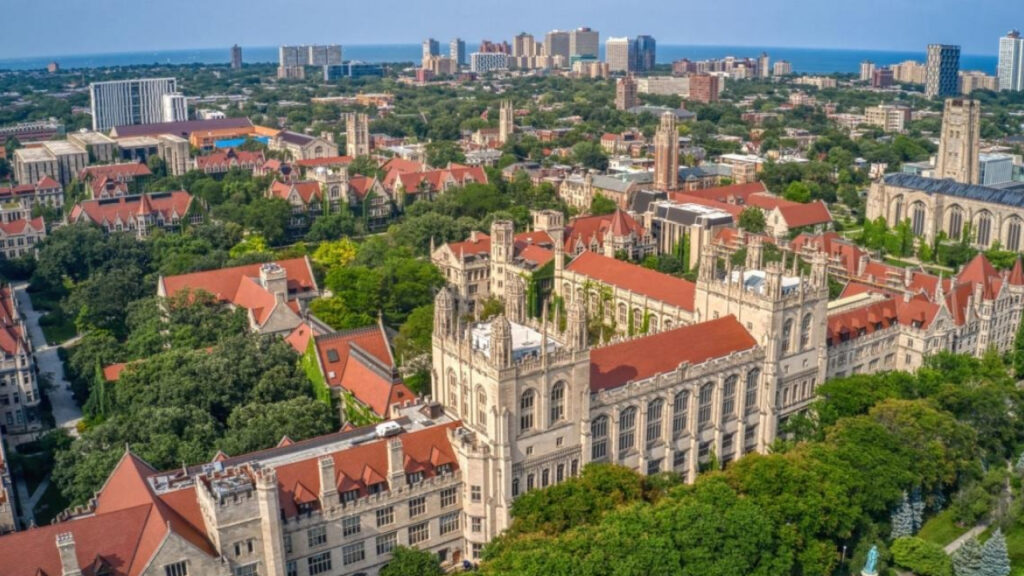
17. University of Chicago
Country: United States
Number of Billionaires: 20
Percentage of Billionaires from the Top 100 Universities: 1.38%
Total Net Worth: $278.9B
Net Worth Per Capita: $13.95B
Global Billionaire Wealth Share: 2.05%
Notable Alumni: Larry Ellison, Ramzi Musallam, Nassef Sawiris
The University of Chicago ranks seventeenth and stands out for its strong link to economics and financial strategy.
With 20 billionaire alumni, it produces a relatively small group, but with high-value outcomes. Its $13.95B average per billionaire is among the highest in this range.
What defines Chicago is economic thinking.
Its ecosystem is closely tied to finance, investment strategy, and macro-level decision-making, rather than startups or operational businesses.
This is reflected in its alumni, many of whom are connected to private equity, large-scale investments, and global financial systems.
For students, this represents a clear path.
Chicago is not about building companies from scratch. It is about understanding markets, capital, and strategy at a deeper level.
This positions the University of Chicago as an economics-driven wealth hub, where financial insight and strategic thinking drive high-value outcomes.
18. University of Oxford
Country: United Kingdom
Number of Billionaires: 20
Percentage of Billionaires from the Top 100 Universities: 1.38%
Total Net Worth: $87.7B
Net Worth Per Capita: $4.39B
Global Billionaire Wealth Share: 0.65%
Notable Alumni: Len Blavatnik, Stephen Schwarzman, James Dyson
The University of Oxford ranks eighteenth and represents a global elite pathway to wealth.
With 20 billionaire alumni and $87.7B in total wealth, its scale is moderate compared to top U.S. institutions. However, its influence extends far beyond numbers.
What defines Oxford is prestige and global reach.
Its billionaire output is closely tied to international business, finance, and legacy industries, often operating across multiple countries and sectors.
This is reflected in its alumni, who are linked to global investments, manufacturing, and large-scale business operations.
For students, this represents a distinct path.
Oxford is not about rapid scaling or specialization. It is about building influence, networks, and global positioning over time.
This positions the University of Oxford as a global elite hub, where reputation, access, and international reach shape long-term wealth outcomes.
19. University of Delhi
Country: India
Number of Billionaires: 20
Percentage of Billionaires from the Top 100 Universities: 1.38%
The University of Delhi ranks nineteenth and represents a fast-growing, emerging-market path to wealth.
With 20 billionaire alumni and $66.5B in total wealth, it operates at a smaller scale compared to top global institutions, but reflects strong growth potential.
What defines Delhi is expansion.
Its billionaire output is closely tied to industries like telecom, technology, infrastructure, and real estate, sectors that grow rapidly in developing economies.
This is reflected in its alumni, many of whom have built businesses by scaling within India’s expanding market.
For students, this represents a clear opportunity.
Delhi is not about global dominance from the start. It is about building within a growing economy and scaling with it over time.
This positions the University of Delhi as an emerging-market growth hub, where local scale and long-term expansion drive wealth creation.
20. Cornell University
Country: United States
Number of Billionaires: 18
Total Net Worth: $67.2B
Net Worth Per Capita: $3.73B
Global Billionaire Wealth Share: 0.49%
Notable Alumni: Robert F. Smith, David Duffield, Ratan Tata
Cornell University ranks twentieth and represents a balanced, hybrid path to wealth creation.
With 18 billionaire alumni and $67.2B in total wealth, it sits at the lower end of the top 20 but remains a consistent contributor.
What defines Cornell is versatility.
Its billionaire output spans technology, enterprise software, manufacturing, and diversified business sectors, without relying on a single dominant industry.
This is reflected in its alumni, who are connected to both innovation-driven companies and large-scale traditional businesses.
For students, this represents flexibility.
Cornell is not about one clear path like finance, tech, or ownership. It offers a mix, allowing you to move across industries and combine different skill sets.
This positions Cornell University as a hybrid wealth hub, where combining technology, business, and operations can create multiple paths to success.
Which Subjects Produce the Most Billionaires?
If you’re studying one of these subjects, you’re not guaranteed to become a billionaire.
But the data shows something interesting: you might already be closer to the paths that many billionaires have taken.
Choosing the right university matters. But what you study often shapes how you think, what problems you solve, and how you create value. And that’s where the real difference begins.
Across 3,184 billionaires analyzed, clear patterns start to appear. Certain fields consistently show up more often, not because they guarantee success, but because they align with how wealth is actually built in the real world.
Some fields teach you how to build and scale businesses. Others teach you how to create systems, technology, or innovation. And a few shape how you think, make decisions, and operate in high-stakes environments.
One of the most interesting patterns is how different fields combine. For example, about 1 in 8 engineering billionaires also pursued a business degree or MBA, showing how technical expertise and business thinking often work together to create large-scale wealth.
This section breaks that down.
You’ll see which subjects dominate, why they matter, and what kind of path each one represents. Not just in theory, but in how wealth is created at scale.
All percentages are based on 3,184 billionaires globally. Verified education data was available for 78.91%, while 21.09% remains unknown or not publicly documented.
1. Business and Economics
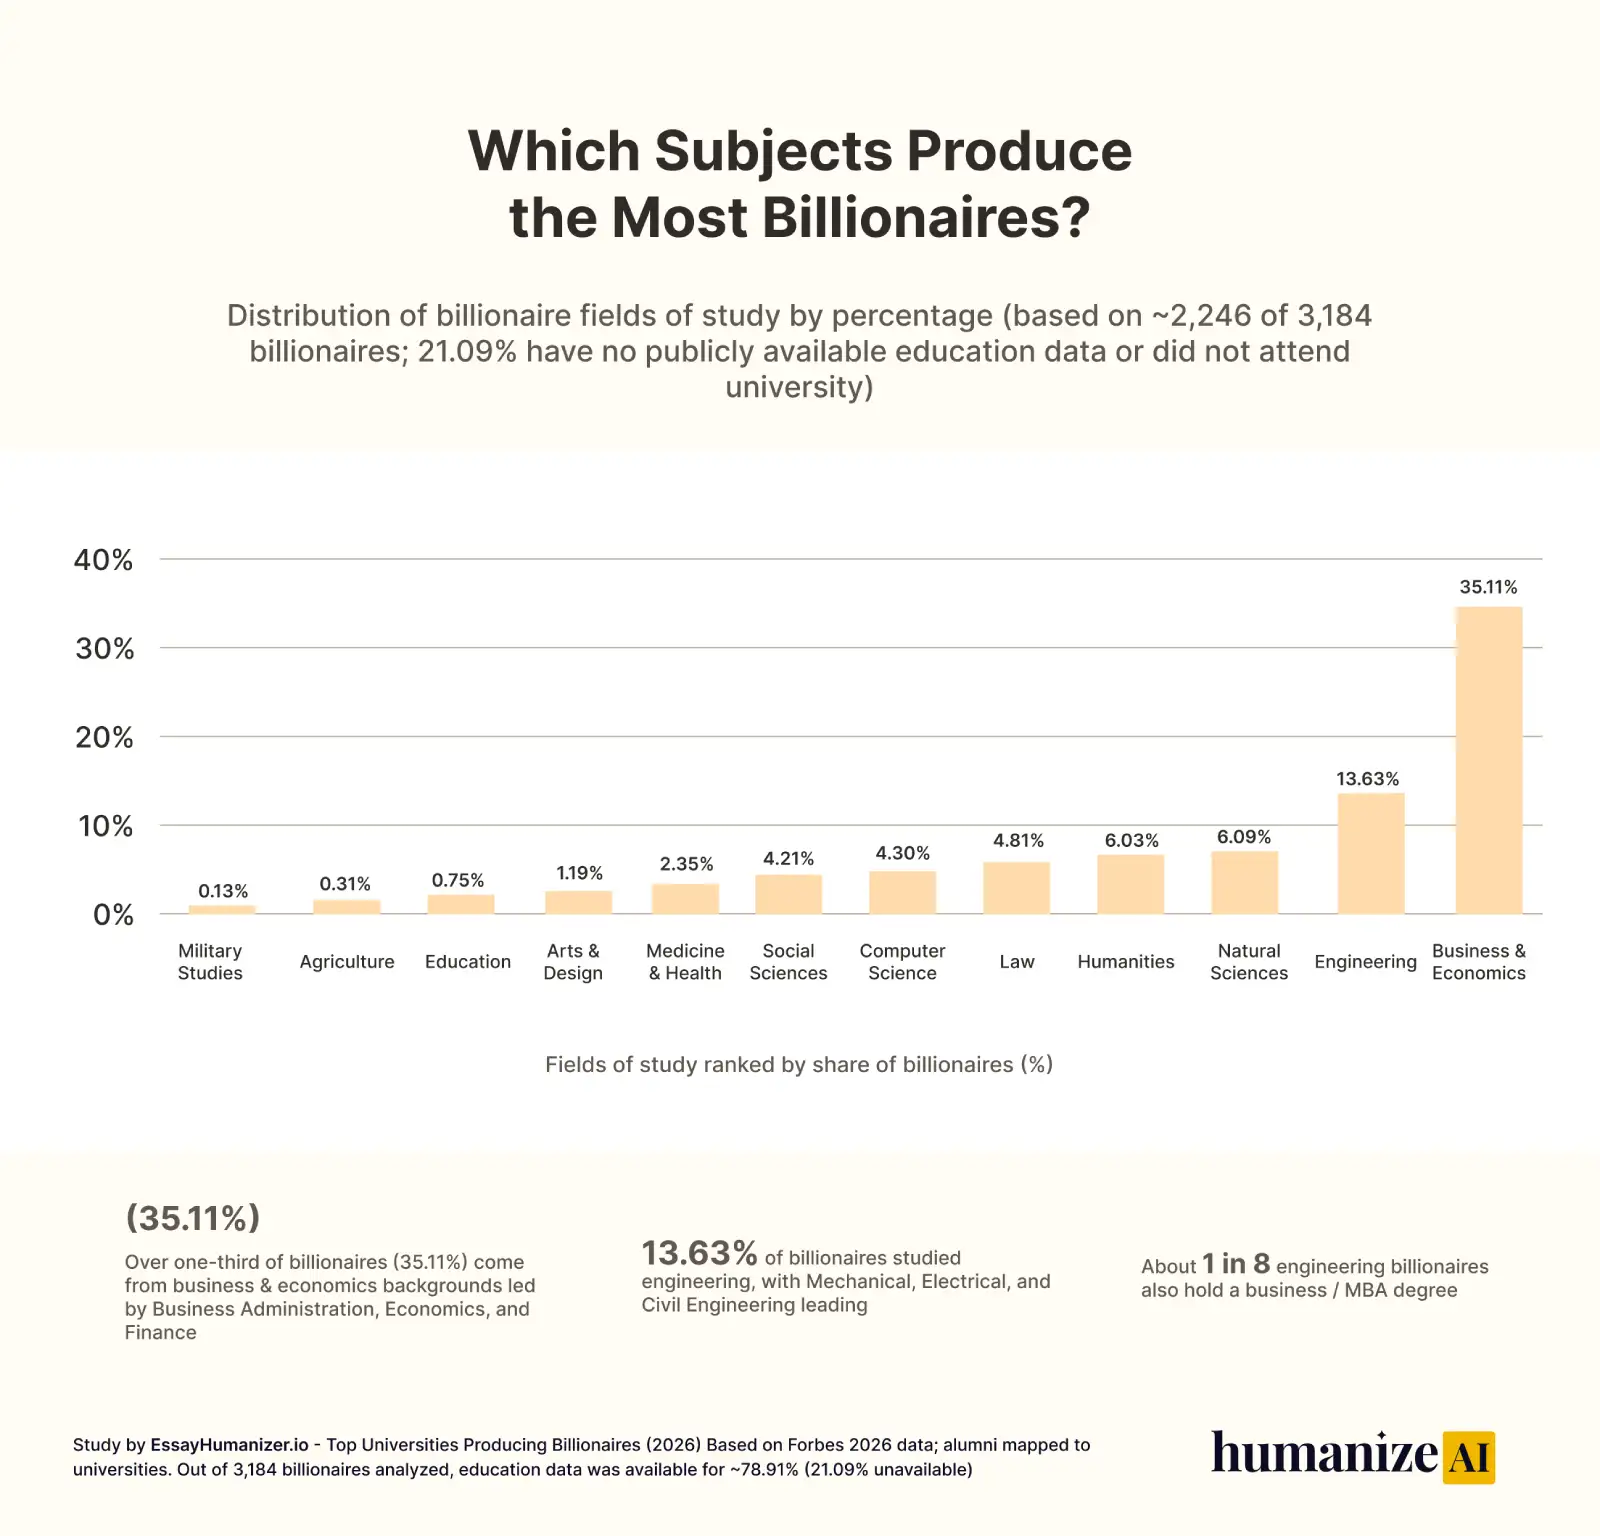
Share of Billionaires: 35.11%
If you had to pick one academic path that shows up again and again behind billionaire success, this is it.
Business and Economics dominate with 35.11% of billionaires, meaning more than 1 in 3 come from this background. But what’s more interesting is which parts of this field actually lead the way.
Business Administration alone accounts for 11.21%, making it the single most common subject. Economics follows at 6.39%, then Finance at 4.42%. After that, you still see meaningful contributions from Management, Accounting, Commerce, and even MBA programs.
That tells you something important.
Wealth is not coming from one narrow path. It’s coming from understanding how businesses operate, how markets behave, and how money is managed across different layers.
This is why this field keeps producing outcomes. It teaches you how to spot opportunities, allocate capital, and scale ideas. Whether it’s building a startup, running a company, or investing in one, these are the skills that sit at the center of most billionaire journeys.
If you choose this path, you’re not locking yourself into one industry. You’re learning the language of business itself. And that’s what makes it powerful across tech, finance, real estate, and beyond.
In simple terms, this is not just the most common path. It’s the most adaptable one if your goal is to understand how wealth is created and multiplied.
2. Engineering
Share of Billionaires: 13.63%
If you’re someone who enjoys building things, solving problems, or understanding how systems work, engineering is one of the most powerful paths you can take.
It accounts for 13.63% of billionaires, making it the second most common background. But within engineering, a few fields clearly stand out. Mechanical engineering leads at 3.24%, followed by electrical engineering at 3%, and civil engineering at 1.74%. These are industries where innovation turns into real-world products, infrastructure, and scalable businesses.
But here’s where it gets really interesting.
About 1 in 8 engineering billionaires also hold a business degree or MBA. That tells you something most students overlook. Engineering alone helps you build great products, but combining it with business knowledge is what helps you scale those products into billion-dollar companies.
Think about it this way.
Engineering teaches you how things work. Business teaches you how to make them grow. When you combine both, you’re no longer just solving problems — you’re building companies that can dominate markets.
So if you’re choosing engineering, you don’t need to limit yourself. The real advantage comes when you pair your technical skills with an understanding of markets, money, and strategy.
It’s not the most direct path like business. But when done right, it’s one of the most powerful.
3. Computer Science
If you’re thinking about building apps, platforms, or even the next big tech company, computer science is one of the most direct modern paths to wealth.
Computer Science accounts for 4.30% of billionaires. Within this category, computer science leads at 1.74%, followed by software engineering at 0.71% and computer engineering at 0.63%. Fields like AI, data science, and machine learning are still smaller today, but they are growing fast.
This path is closely tied to industries like software, SaaS, AI, and digital platforms, where products can scale globally with very low marginal cost.
That’s what makes it different.
You’re not just building something once. You’re building something that can reach millions or even billions of users without needing to scale resources the same way traditional businesses do.
Think about it this way.
Computer science teaches you how to build systems that scale. But wealth comes from turning those systems into products that people actually use.
For students, this path is one of the fastest when done right.
It is not the most common yet, but it offers one of the highest ceilings in terms of speed, scale, and global impact.
3. Natural Sciences
Share of Billionaires: 6.09%
If you’re someone who enjoys discovery and understanding how the world works at a deeper level, natural sciences offer a very different path to wealth.
Natural Sciences account for 6.09% of billionaires, making it a smaller but still meaningful path. Within this group, physics (1.50%) and chemistry (1.42%) lead, followed by biology (1.03%) and mathematics (0.87%).
This category sits behind industries where breakthroughs create massive long-term value. Physics and chemistry connect to energy and deep-tech innovation, while biology dominates pharmaceuticals and biotech. Mathematics, though less visible, powers the systems and models behind many of these advancements.
But here’s the key difference.
This is not about speed.
Most wealth here comes from long research cycles, development, and commercialization. Unlike fast-scaling startups, these paths require patience and deep expertise.
Think about it this way.
Natural sciences teach you how the world works at its core. Turning that into wealth depends on how you apply it through innovation, patents, or building companies around scientific breakthroughs.
For students, this path is less obvious, but still powerful.
Slower to start, but when it works, it creates impact at an industry level, not just a company level.
4. Humanities
Share of Billionaires: 6.03%
If you’re drawn to ideas, leadership, communication, or understanding people, the humanities may feel like an unexpected path to wealth, but the data shows it matters more than most people assume.
Humanities account for 6.03% of billionaires. Within this category, philosophy leads at 1.26%, followed by history at 1.11% and literature at 0.87%.
This path does not usually create wealth in a direct way like business or engineering. Instead, it builds something different: judgment, communication, perspective, and the ability to understand people, power, and culture.
That matters more than it seems.
Many billionaire journeys depend on negotiation, storytelling, leadership, and decision-making at scale. Humanities help shape those abilities, which is why this background often appears behind roles in business, politics, media, and influence-driven industries.
Think about it this way.
Humanities teach you how people think and how ideas shape the world. That may not look like a billionaire path at first, but in the right environment, it becomes a strong advantage.
For students, this path is less direct but highly flexible.
It may not give you the clearest formula, but it can give you the skills to lead, persuade, and adapt, which often matter just as much.
5. Law
Share of Billionaires: 4.81%
If you are interested in power, negotiations, and how systems are controlled, the law offers a very strategic path to wealth.
Law accounts for 4.81% of billionaires. Within this category, Law (LLB / JD) leads at 3.00%, followed by Legal Studies at 0.47%, Corporate Law and International Law at 0.39% each, Constitutional Law at 0.32%, and Jurisprudence / Legal Theory at 0.24%.
This path is not about building products or technical systems. It is about understanding how rules, contracts, and structures shape business and ownership.
That’s where the advantage comes in.
Many billionaires with legal backgrounds are closely connected to corporate leadership, major deals, and high-stakes negotiations. Law places you in environments where decisions about ownership, partnerships, and capital are made.
Think about it this way.
Law teaches you how systems are built and controlled. But wealth comes from using that knowledge to structure deals, manage risk, and operate at the highest level.
For students, this path is more strategic than direct.
It does not create wealth on its own, but it puts you close to power and decision-making, which is often where the biggest opportunities exist.
6. Computer Science
Share of Billionaires: 4.30%
If you’re thinking about building apps, platforms, or even the next big tech company, computer science is one of the most direct modern paths to wealth.
Computer Science accounts for 4.30% of billionaires. Within this category, computer science leads at 1.74%, followed by software engineering at 0.71% and computer engineering at 0.63%. Fields like AI, data science, and machine learning are still smaller today, but they are growing fast.
This path is closely tied to industries like software, SaaS, AI, and digital platforms, where products can scale globally with very low marginal cost.
That’s what makes it different.
You’re not just building something once. You’re building something that can reach millions or even billions of users without needing to scale resources the same way traditional businesses do.
Think about it this way.
Computer science teaches you how to build systems that scale. But wealth comes from turning those systems into products that people actually use.
For students, this path is one of the fastest when done right.
It is not the most common yet, but it offers one of the highest ceilings in terms of speed, scale, and global impact.
7. Social Sciences
Share of Billionaires: 4.21%
If you are interested in how people think, how societies operate, and how decisions shape entire systems, the social sciences offer a strategic path to wealth.
Social Sciences account for 4.21% of billionaires. Within this category, political science leads at 1.26%, followed by psychology at 0.71% and sociology at 0.63%. Fields like international relations (0.55%) and public policy (0.32%) also play a role.
This path is not about building products or writing code. It is about understanding behavior, power structures, and how systems evolve over time.
That’s what makes it valuable.
Many billionaires from this background operate in areas where influence matters more than execution, such as government, global business, media, and large organizations.
Think about it this way.
Social sciences teach you how people and systems behave. But wealth comes from using that understanding to lead, influence decisions, and operate at scale.
For students, this path is not the most direct, but it is highly flexible.
It does not give you a fixed formula, but it gives you the ability to navigate complex systems, which is often where the biggest opportunities exist.
8. Medicine and Health
Share of Billionaires: 2.35%
If you are interested in saving lives, building healthcare systems, or solving real-world human problems, medicine and health offer a very different path to wealth.
Medicine and Health account for 2.35% of billionaires. Within this category, medicine (MD) leads at 1.10%, followed by surgery at 0.32%, and fields like public health and pharmacology at 0.24% each.
This path is not about fast growth or quick exits. It is closely tied to industries like healthcare, pharmaceuticals, biotech, and medical innovation, where outcomes take time but can scale massively.
Many billionaires from this background are connected to drug development, healthcare companies, or breakthrough treatments. In some cases, a single innovation or medical product can create enormous value.
Think about it this way.
Medicine teaches you how to solve real human problems at scale. But building wealth depends on how you apply that knowledge through innovation, research, or building companies around healthcare solutions.
For students, this path is slower and more demanding, but very meaningful.
It does not offer speed, but when combined with innovation or business, it can create both impact and long-term wealth.
9. Arts and Design
Share of Billionaires: 1.19%
If you are someone who enjoys creativity, visual thinking, or building brands and experiences, arts and design offer a unique but less direct path to wealth.
Arts and Design account for 1.19% of billionaires. Within this category, fine arts (0.24%) and music or performing arts (0.20%) lead, followed by graphic design, fashion design, film studies, and architecture at smaller shares.
This path is not about traditional business or technical systems. It is about creating value through creativity, culture, and audience connection.
That’s where the opportunity lies.
Many billionaires in this space are connected to industries like entertainment, fashion, media, and design-driven brands, where influence, identity, and consumer attention drive massive value.
Think about it this way.
Arts and design teach you how to create things people care about. But wealth comes from turning that creativity into scalable brands, platforms, or businesses.
For students, this path is less predictable, but still powerful.
It does not offer a clear formula, but when combined with business or technology, it can create highly scalable and influential ventures.
10. Education
Share of Billionaires: 0.75%
If you are passionate about teaching, learning systems, or shaping how knowledge is delivered, education offers a very different and less obvious path to wealth.
Education accounts for 0.75% of billionaires. Within this category, education leads at 0.31%, followed by teaching (0.16%) and educational leadership (0.12%), with smaller contributions from curriculum studies and instructional design.
This path is not about building products or traditional businesses at first. It is about understanding how people learn and how systems of knowledge are structured.
That may seem far from wealth, but it creates a unique advantage.
Many opportunities in this space come from building educational platforms, institutions, or scalable learning systems. With the rise of online education, EdTech, and global learning platforms, this field has started to connect more directly with business and technology.
Think about it this way.
Education teaches you how knowledge is created and shared. But wealth comes from scaling that knowledge through systems, platforms, or institutions.
For students, this path is rare but evolving.
It does not offer a direct route, but when combined with technology or business, it can turn learning into a scalable and impactful opportunity.
11. Agriculture
Share of Billionaires: 0.31%
If you are interested in food systems, land, and resources, agriculture offers a traditional but often overlooked path to wealth.
Agriculture accounts for 0.32% of billionaires. Within this category, agriculture leads at 0.16%, followed by agribusiness and agricultural economics at smaller shares.
This path is not about digital scale or fast growth. It is about controlling resources, supply chains, and production at scale.
That’s where the value comes from.
Many billionaires in this space are connected to large-scale farming, food production, commodities, and land ownership.
Think about it this way.
Agriculture teaches you how to produce essential resources. But wealth comes from scaling production, distribution, and ownership.
For students, this path is rare but grounded.
It is slower, but when scaled, it can create long-term and stable wealth.
12. Military Studies
Share of Billionaires: 0.13%
If you are interested in strategy, discipline, and leadership under pressure, military studies offer a very indirect path to wealth.
Military Studies account for 0.28% of billionaires. Within this category, military science leads at 0.14%, followed by defense studies and strategic studies at smaller shares.
This path is not about business or building products. It is about leadership, structure, and high-level decision-making.
That’s where the edge comes in.
Many individuals from this background transition into leadership roles in government, defense, or large organizations where influence and control create opportunities.
Think about it this way.
Military studies teach you how to lead and operate systems. But wealth comes from applying that leadership in business, strategy, or large-scale operations.
For students, this path is uncommon.
It is not a direct route, but it can open doors to positions where major decisions and opportunities exist.
Note: Unknown or Unavailable Education Data
Share of Billionaires:21.09%
A significant portion of billionaires fall into this category.
This shows that some paths to wealth are not clearly tied to formal education, and in many cases, educational data is either incomplete or unavailable to the public.
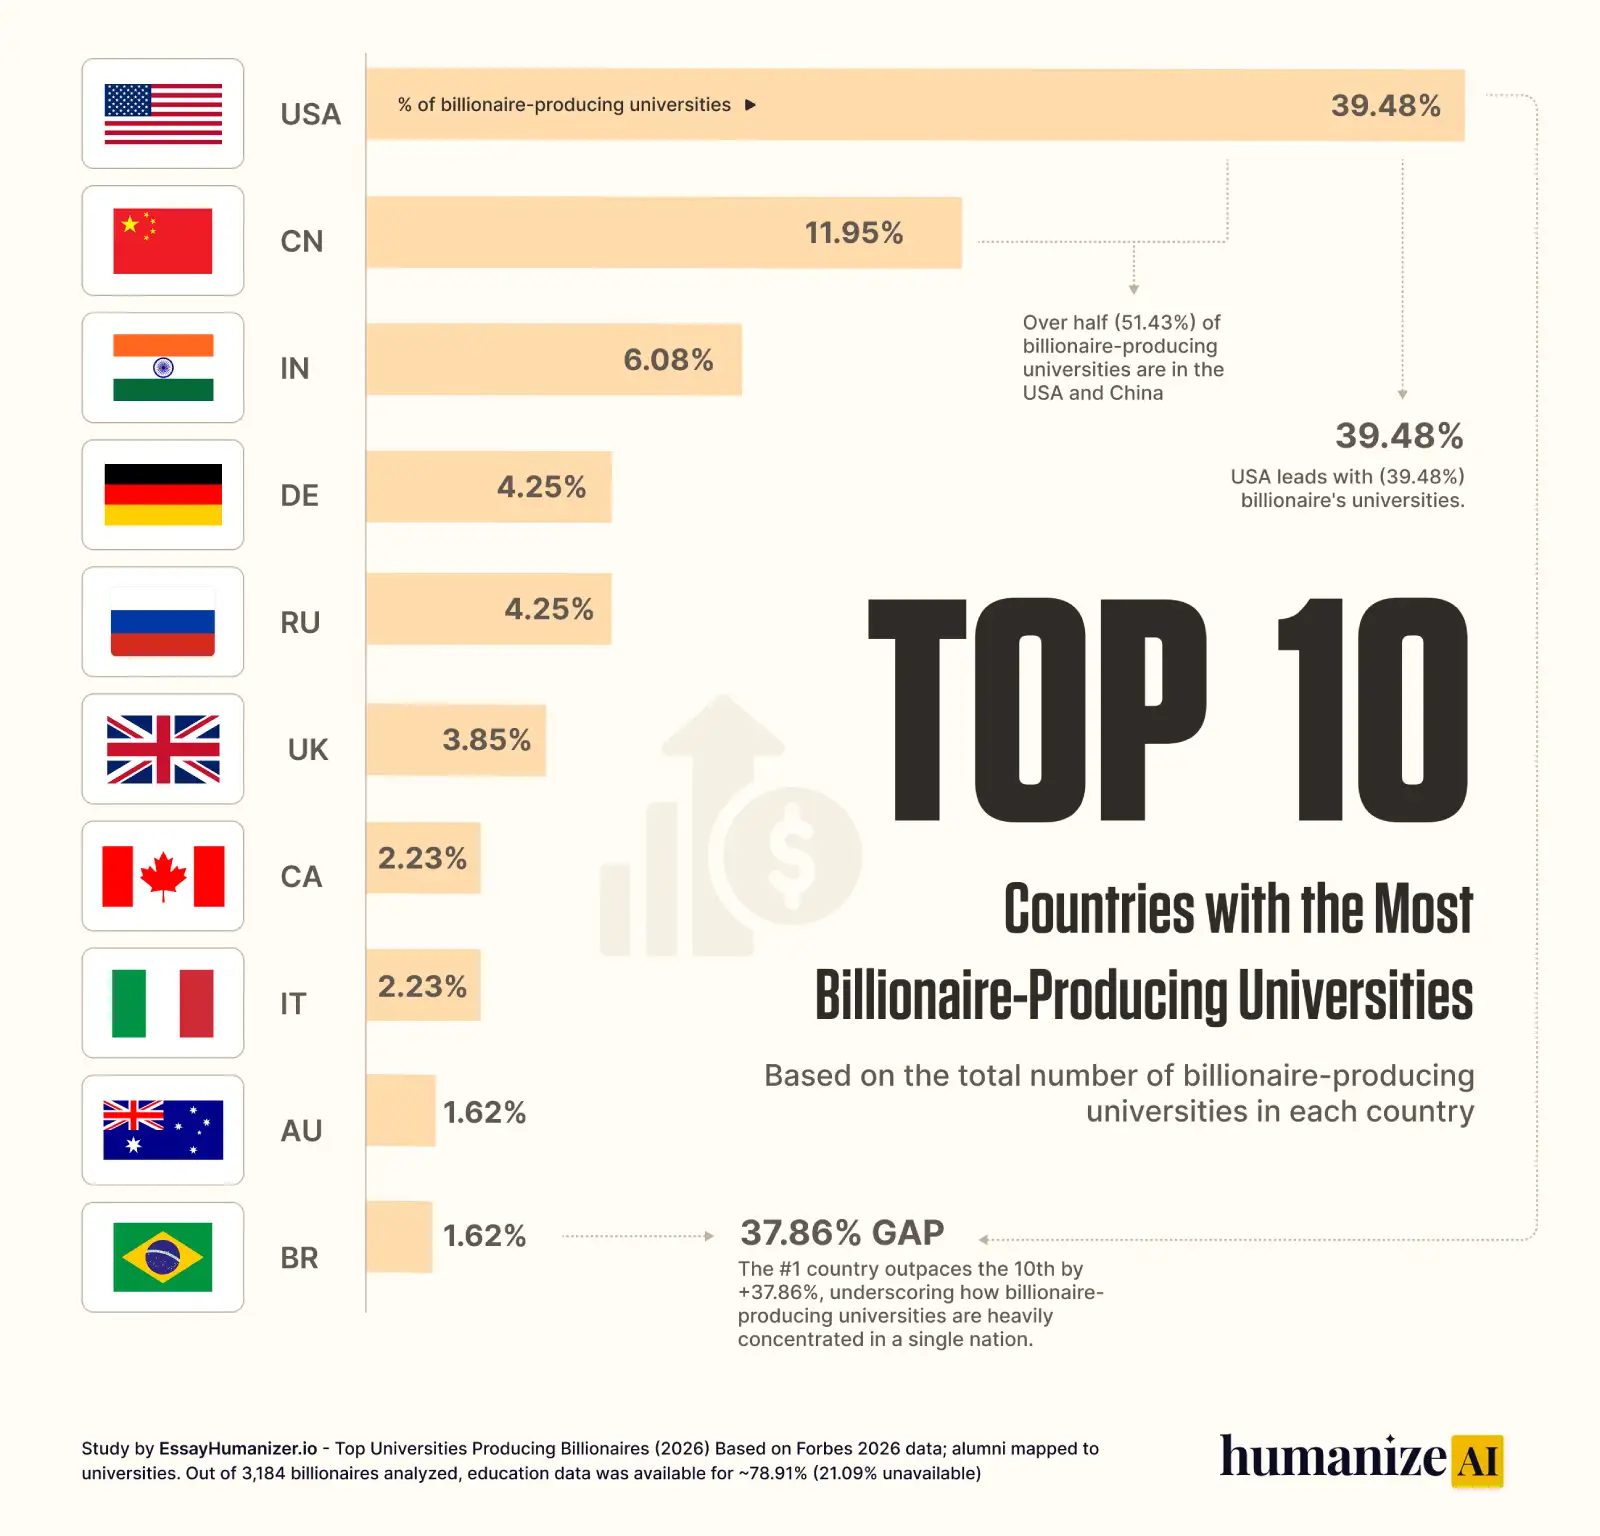
Top 10 Countries with the Most Billionaire Universities
Not all countries create the same level of opportunity when it comes to wealth.
One pattern stands out immediately. Over half (51.43%) of all billionaire-producing universities are concentrated in just the United States and China. This shows how heavily global wealth pipelines are centered around a few dominant systems.
The gap is even more striking when you look deeper.
The difference between the United States and the 10th-ranked country is 37.86%, meaning the U.S. alone has roughly 24 times more billionaire-producing universities than countries at the lower end of the top 10.
For students, this highlights something important without overcomplicating it.
Opportunity is not evenly distributed. Some countries simply offer a much stronger environment for scaling ideas, access, and long-term outcomes.
In the next section, we break down which countries lead and what makes them different.
1. United States
Share of Billionaire Producing Universities: 39.48%
For students thinking about long-term scale and opportunity, the United States stands at the center of global wealth creation.
It has 195 billionaire-producing universities, accounting for 39.48% of all countries in the world. In total, these universities have produced 807 billionaires, which is about 86.4% of the country’s total billionaire count.
That connection is important.
It shows how closely the education system is tied to real wealth creation, far more than in any other country.
What makes the U.S. different is the environment around its universities. Strong startup ecosystems, access to venture capital, and direct exposure to global industries make it easier for ideas to grow beyond just concepts.
For students, this is where the advantage becomes clear.
You are not just gaining education. You are entering a system where funding, networks, and opportunities already exist, making it more realistic to build something that can scale at a global level.
2. China
Share of Billionaire Producing Universities: 11.95%
For students looking at large-scale opportunities in a fast-growing system, China stands out as a strong and evolving pathway.
It has 59 billionaire-producing universities, accounting for 11.95% of all countries in the world. In total, these universities have produced 224 billionaires, which is about 40.65% of the country’s total billionaire count.
That connection matters because it shows how education is closely tied to wealth creation in a rapidly expanding economy.
What makes China different is its speed and scale. Strong industrial growth, government support, and a massive domestic market create opportunities across technology, manufacturing, and infrastructure.
For students, the advantage is clear. You are entering an environment where industries grow quickly, and opportunities can scale within a large and active market.
3. India
Share of Billionaire Producing Universities: 6.08%
For students looking at emerging opportunities and long-term growth, India offers a developing but promising pathway.
It has 29 billionaire-producing universities, accounting for 6.08% of all countries in the world. In total, these universities have produced 168 billionaires, which is about 78.14% of the country’s total billionaire count.
That connection shows how education is playing a growing role in wealth creation within an expanding economy.
What makes India different is its fast-growing digital ecosystem, large talent pool, and rising startup activity, especially in technology and services.
For students, the advantage is more gradual. You are entering a system that is still scaling, where opportunities are increasing over time and can grow with the right positioning.
4. Germany
Share of Billionaire Producing Universities: 4.25%
For students looking at structured industries and long-term stability, Germany offers a strong and reliable pathway.
It has 21 billionaire-producing universities, accounting for 4.25% of all countries in the world. In total, these universities have produced 90 billionaires, which is about 52.94% of the country’s total billionaire count.
That connection reflects how education aligns closely with industrial strength, especially in sectors like manufacturing, engineering, and automotive.
What makes Germany different is its focus on precision, technical excellence, and strong industry-university collaboration.
For students, the advantage lies in entering a system where expertise and long-term value creation are highly emphasized.
5. Russia
Share of Billionaire Producing Universities: 4.25%
For students interested in resource-driven industries and technical depth, Russia presents a distinct pathway.
It has 21 billionaire-producing universities, accounting for 4.25% of all countries in the world. In total, these universities have produced 106 billionaires, which is about 81.54% of the country’s total billionaire count.
That connection highlights how education plays a strong role in wealth creation, especially in industries tied to energy, resources, and infrastructure.
What makes Russia different is its strong technical education base and deep connection to large-scale industrial sectors.
For students, the advantage lies in entering systems where scale often comes from control over assets and long-term strategic industries.
6. United Kingdom
Share of Billionaire Producing Universities: 3.85%
For students looking at global exposure and financial ecosystems, the United Kingdom offers a well-established pathway.
It has 19 billionaire-producing universities, accounting for 3.85% of all countries in the world. In total, these universities have produced 33 billionaires, which is about 38.82% of the country’s total billionaire count.
That connection reflects how education is linked to wealth creation, particularly in finance, global business, and international markets.
What makes the UK different is its access to global networks and its strong position in industries like finance, consulting, and media.
For students, the advantage lies in being part of an internationally connected system where opportunities often extend beyond local markets.
7. Canada
Share of Billionaire Producing Universities: 2.23%
For students looking for a balanced and steadily growing ecosystem, Canada offers a stable pathway.
It has 11 billionaire-producing universities, accounting for 2.23% of all countries in the world. In total, these universities have produced 59 billionaires, which is about 74.68% of the country’s total billionaire count.
That connection shows how education is contributing to wealth creation, especially in sectors like technology, natural resources, and services.
What makes Canada different is its stable economy, growing tech sector, and strong quality of life.
For students, the advantage lies in entering a supportive environment where opportunities are expanding over time.
8. Italy
Share of Billionaire Producing Universities: 2.23%
For students interested in brand-driven industries and global consumer markets, Italy offers a unique pathway.
It has 11 billionaire-producing universities, accounting for 2.23% of all countries in the world. In total, these universities have produced 51 billionaires, which is about 67.11% of the country’s total billionaire count.
That connection reflects how education supports wealth creation in industries like fashion, luxury goods, and manufacturing.
What makes Italy different is its strength in design, craftsmanship, and globally recognized brands.
For students, the advantage lies in entering industries where value is built through identity, creativity, and long-standing expertise.
9. Australia
Share of Billionaire-Producing Universities: 1.62%
For students looking at globally connected markets with strong education systems, Australia offers a growing pathway.
It has 8 billionaire-producing universities, accounting for 1.62% of all countries in the world. In total, these universities have produced 28 billionaires, which is about 42.42% of the country’s total billionaire count.
That connection shows how education is contributing to wealth creation, particularly in sectors like mining, services, and technology.
What makes Australia different is its access to Asia-Pacific markets, combined with strong academic institutions.
For students, the advantage lies in being part of a globally connected environment with emerging opportunities.
10. Brazil
Share of Billionaire Producing Universities: 1.62%
For students interested in large domestic markets and resource-driven growth, Brazil offers an evolving pathway.
It has 8 billionaire-producing universities, accounting for 1.62% of all countries in the world. In total, these universities have produced 45 billionaires, which is about 66.18% of the country’s total billionaire count.
That connection highlights how education supports wealth creation in industries like agriculture, energy, and commodities.
What makes Brazil different is its scale in natural resources and strong internal market demand.
For students, the advantage lies in entering a system where growth is driven by domestic expansion and resource-based industries.
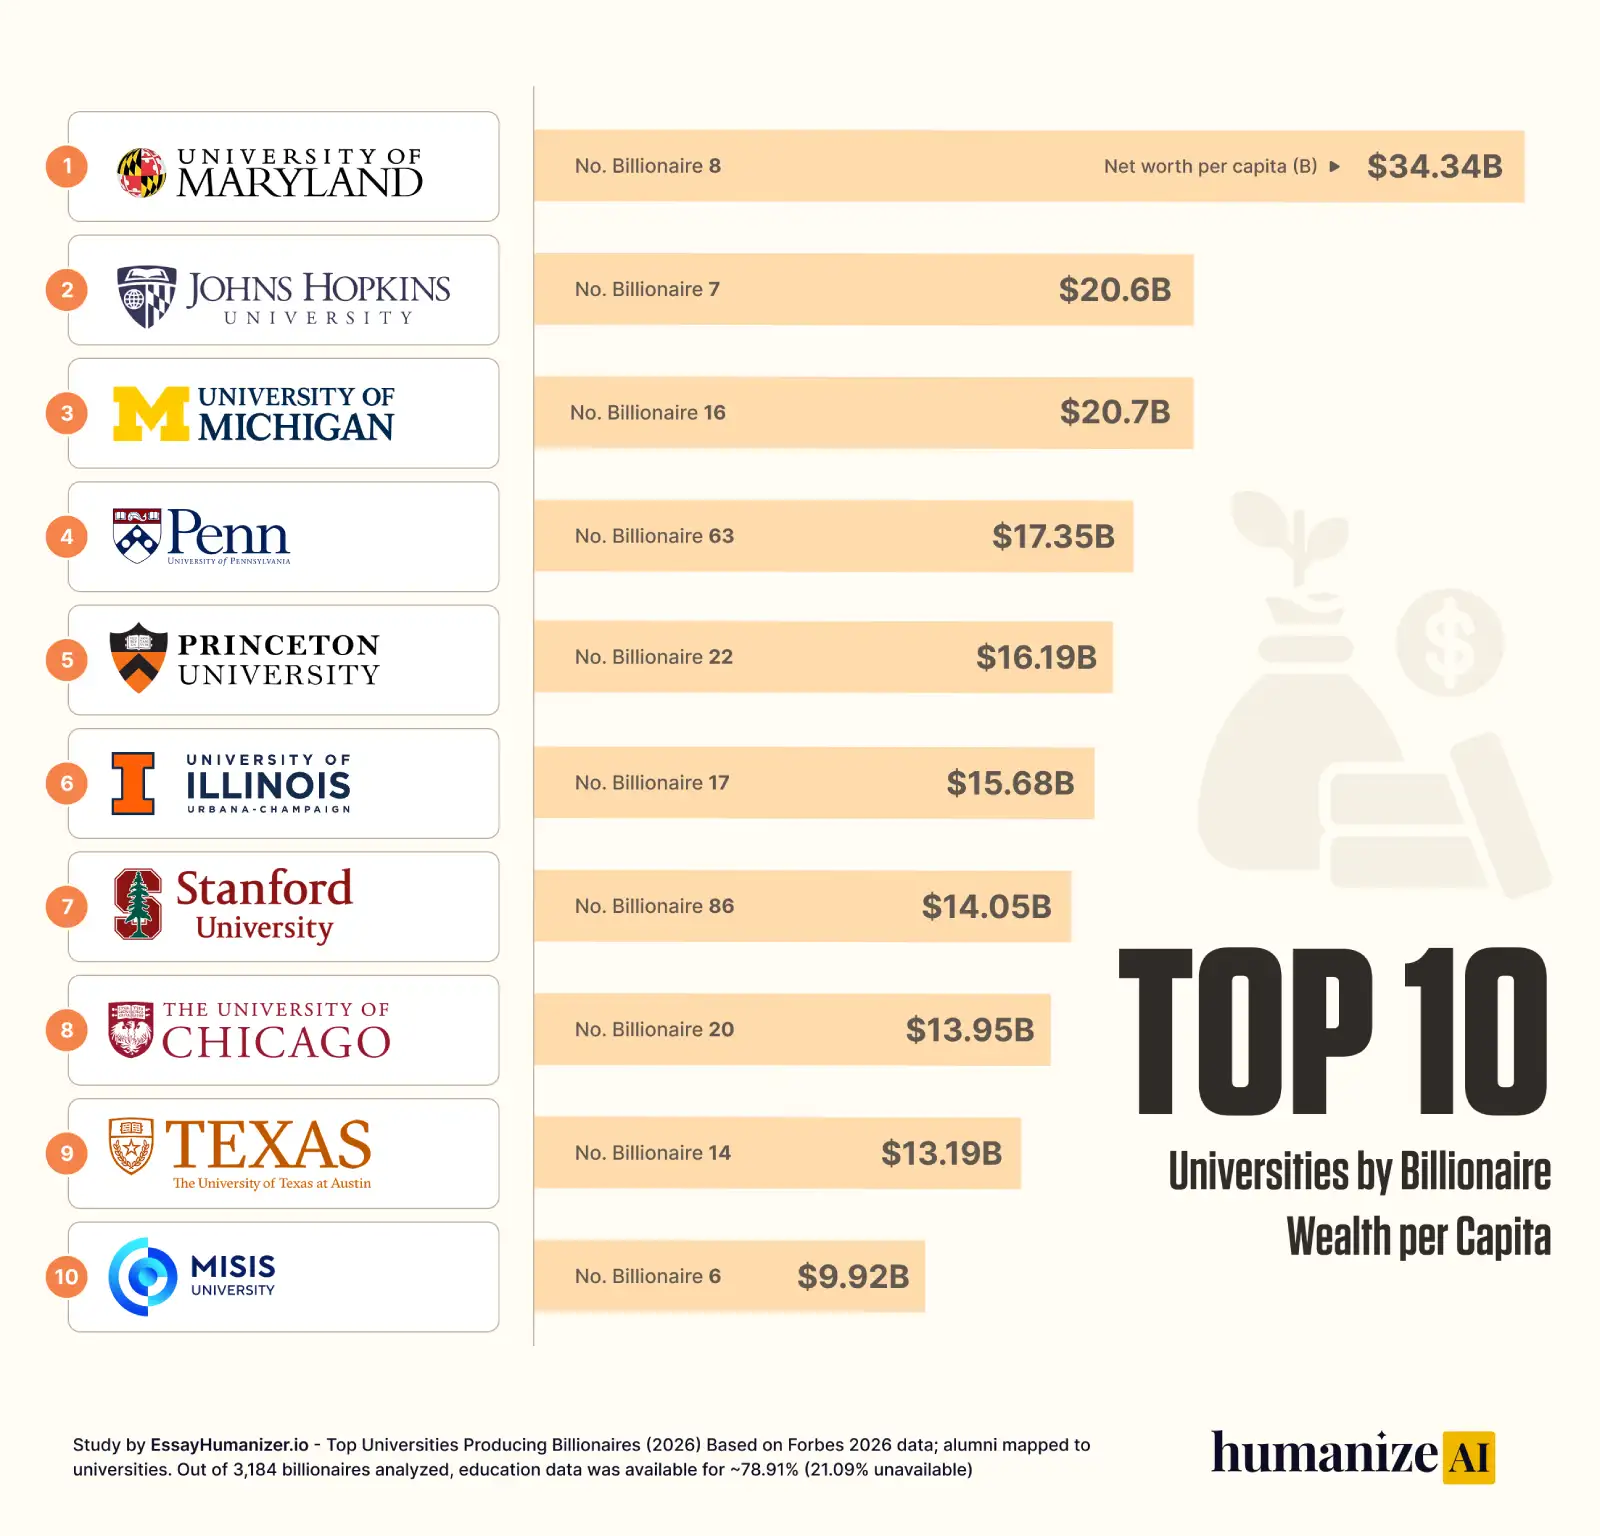
Top 10 Universities by Per Capita Billionaire Wealth
This ranking looks at average wealth per billionaire alumni, not how many billionaires a university produces.
In simple terms, it answers one question: Where do the richest billionaires come from, on average?
This shifts the focus from volume to wealth concentration. Some universities may produce fewer billionaires, but those individuals control significantly larger wealth.
1. University of Maryland
Maryland takes the top spot with the highest billionaire wealth per person.
Each billionaire from this university holds, on average, $34.34B, making it the most concentrated wealth output in the dataset. What makes this remarkable is scale. With only 8 billionaires, it still outperforms every major institution.
Maryland’s output is 3.72X greater than Harvard University’s at $9.22 billion per person.
This clearly shows that Maryland is not about volume. It is about producing fewer but exceptionally wealthy individuals.
2. Johns Hopkins University
Johns Hopkins ranks second, again showing strong wealth concentration per individual.
With an average of $20.60B per billionaire, its alumni are among the most financially powerful despite smaller numbers.
The pattern here is clear. Wealth is not widely distributed. Instead, it is concentrated among a small number of very high-value individuals.
3. University of Michigan
Michigan is one of the most balanced institutions in this ranking.
It manages to combine a relatively high number of billionaires with strong per capita wealth at $20.07B.
This is rare. Most universities either produce many billionaires or very wealthy ones. Michigan does both, making it a dual-strength institution.
4. University of Pennsylvania
The University of Pennsylvania stands out for maintaining high wealth per person at scale.
With 63 billionaires and an average of $17.35B, it proves that large ecosystems can still generate high individual wealth.
It is also one of only three universities where total alumni wealth exceeds $1 trillion, reinforcing both scale and strength.
5. Princeton University
Princeton’s ranking reflects high-value outcomes per individual, not just output size.
At $16.19B per billionaire, its alumni are associated with some of the most impactful global businesses, which drives up average wealth.
This shows a pattern of quality over quantity.
6. University of Illinois
The University of Illinois demonstrates how technical and industrial exposure translates into high-value individual wealth.
With $15.68B per billionaire, it shows strong performance despite not being among the highest in total count.
This suggests a focus on industries where wealth scales significantly per individual.
7. Stanford University
Stanford remains one of the most unique institutions in the dataset.
With 86 billionaires and $14.05B per person, it combines massive scale with high individual wealth, something very few universities achieve.
It is also one of the three universities with over $1 trillion in alumni wealth, highlighting its dominance in both dimensions.
8. University of Chicago
The University of Chicago’s position is driven by its deep connection to finance and investment ecosystems.
At $13.95B per billionaire, its alumni benefit from industries where capital concentration is naturally higher.
This reinforces the link between financial sectors and higher per capita wealth.
9. University of Texas at Austin
UT Austin’s ranking reflects strong exposure to energy, technology, and media industries.
With an average of $13.19B, its billionaires benefit from sectors where growth and valuation can scale rapidly.
This highlights how industry alignment plays a key role in wealth concentration.
10. National University of Science and Technology MISIS
MISiS rounds out the top 10 with a clear pattern.
Despite having only 6 billionaires, it maintains a high average of $9.92B, driven by resource-heavy industries like metals and energy.
This reinforces a recurring theme in this section: resource-based sectors often produce fewer but highly wealthy individuals.
Top 10 U.S. States with the Most Billionaire-Producing Universities (2026)
When you step back and look at the global picture, one thing becomes hard to ignore: the United States isn’t just part of this story; it’s dominating it.
The country alone accounts for 39.48% of all billionaire-producing universities worldwide. But what’s more interesting is how that dominance actually works.
It doesn’t spread evenly across the country.
It concentrates.
The same pattern you see globally shows up again at the state level. California and New York lead by a wide margin, contributing 16.06% and 13.14%, respectively. And when you zoom out slightly, the picture becomes even clearer; the top 10 states together account for 67.15% of all billionaire-producing universities in the USA.
That’s not random.
It points to a deeper structural reality: opportunity, capital, and high-growth ecosystems tend to cluster in specific regions, and those regions consistently produce a disproportionate share of billionaire outcomes.
Which naturally leads to a more practical question, especially for students and data-driven readers:
If the U.S. is leading globally, then which states actually offer the strongest environment for future success?
Because choosing a country is one decision. Choosing the right state within that country is where the real difference starts to show.
Rank
State
Number of Billionaire-Producing Universities
Percentage of Billionaire-Producing Universities (in the USA)
A few Top Universities
1
California
22
16.06%
Stanford UniversityUniversity of California, BerkeleyUniversity of California, Los Angeles
2
New York
18
13.14%
Columbia UniversityCornell UniversityNew York University
3
Massachusetts
13
9.49%
Massachusetts Institute of TechnologyHarvard UniversityTufts University
4
Texas
7
5.11%
University of Texas at AustinTexas A&M UniversitySouthern Methodist University
5
Pennsylvania
7
5.11%
University of PennsylvaniaCarnegie Mellon UniversityLehigh University
6
Illinois
7
5.11%
University of ChicagoNorthwestern UniversityUniversity of Illinois Urbana–Champaign
7
Ohio
6
4.38%
Ohio State UniversityCase Western Reserve UniversityUniversity of Cincinnati
8
Missouri
4
2.92%
Washington University in St. LouisUniversity of MissouriDrury University
9
Indiana
4
2.92%
University of Notre DamePurdue UniversityIndiana University
10
North Carolina
4
2.92%
Duke UniversityUniversity of North Carolina at Chapel HillNorth Carolina State University
1. California — 22 universities (16.06%)
If one state defines how modern billionaire wealth is built, it’s California.
Nearly 1 in every 6 billionaire-producing universities in the U.S. is located here. That concentration reflects how tightly education, venture capital, and technology are connected in this region.
Institutions like Stanford University (86 billionaires) and the University of California, Berkeley (20 billionaires) sit directly inside that ecosystem. Ideas don’t stay theoretical here; they scale quickly because capital, talent, and networks are already in place.
This is less about education alone and more about proximity to where innovation turns into wealth.
2. New York — 18 universities (13.14%)
New York operates on a different axis.
Here, the advantage comes from being close to capital. With over 13% of billionaire-producing universities, the state reflects how access to financial markets can shape outcomes.
Universities like Columbia University and New York University are embedded in one of the most powerful financial ecosystems in the world. That proximity changes how quickly ideas can be funded, scaled, and expanded.
3. Massachusetts — 13 universities (9.49%)
Massachusetts doesn’t rely on volume. It relies on influence.
Even with a smaller share, it hosts two of the most powerful institutions in the dataset, Harvard University (134 billionaires) and Massachusetts Institute of Technology (39 billionaires).
That concentration creates an environment where research, capital, and innovation overlap tightly. The result isn’t just output; it’s high-impact output.
4. Texas — 7 universities (5.11%)
Texas shows a different path.
The billionaire pipeline here is tied more to industry scale than startup ecosystems. Growth comes from sectors like energy, real estate, and large enterprise operations.
Universities such as the University of Texas at Austin play into that structure, where expansion and execution matter more than early-stage disruption.
5. Pennsylvania — 7 universities (5.11%)
Pennsylvania sits at the intersection of finance and institutional power.
With the University of Pennsylvania (63 billionaires), the state consistently produces outcomes tied to capital, investment strategy, and enterprise leadership.
There’s a balance here; technical capability meets financial depth.
6. Illinois — 7 universities (5.11%)
Illinois is shaped by its corporate backbone.
Anchored by Chicago, the state’s universities feed into finance, private equity, and corporate leadership pipelines. Institutions like the University of Chicago reflect that structure.
Wealth here tends to grow through systems, strategy, and scale rather than rapid disruption.
7. Ohio — 6 universities (4.38%)
Ohio reflects a more traditional trajectory.
The billionaire outcomes tied to this region are often connected to manufacturing, retail, and long-established business operations. Growth is slower but deeply rooted.
This is wealth built over time, not overnight.
8. Missouri — 4 universities (2.92%)
Missouri shows how smaller ecosystems still play a role.
With institutions like Washington University in St. Louis, the state contributes through established industries and long-term capital growth rather than rapid expansion.
9. Indiana — 4 universities (2.92%)
Indiana’s strength lies in consistency.
With Purdue University, the state supports wealth creation through engineering, manufacturing, and logistics, sectors where precision and systems matter more than speed.
10. North Carolina — 4 universities (2.92%)
North Carolina represents a quieter shift.
With institutions like Duke University (13 billionaires), the state is part of a growing ecosystem built around research, healthcare, and technology.
It doesn’t dominate yet, but it’s moving in that direction.
Cross-Analysis: What Actually Drives Billionaire Wealth?
Looking at each dataset separately shows patterns. But when we combine them, the real story becomes clear.
This section links universities, countries, and subjects to reveal the true nature of billionaire wealth creation.
University vs Country Dominance
Billionaire education is not evenly distributed.
The United States and China alone account for 51.43% of billionaire-producing universities, showing a strong concentration of opportunity.
But the structure is different.
The U.S. dominates through diversified industries like tech, finance, and venture capital, while China grows through scale, manufacturing, and digital platforms.
This means billionaire education is not just about institutions. It is about the economic system surrounding them.
Subject vs Wealth Creation
Educational background plays a major role, but not equally across fields.
Business and Economics (35.11%) clearly dominates, making it the strongest foundation for billionaire creation. It provides direct exposure to capital, markets, and decision-making.
Engineering (13.63%) comes next, but with a twist. Many engineers later move into business.
In fact, 1 in 8 engineering billionaires also pursued a business or MBA degree, showing that technical skills alone are often not enough to scale wealth.
Meanwhile, fields like computer science (4.30%) have a smaller share but produce high-impact outcomes, often through large tech companies.
This shows that wealth is not just about what you study, but also how that knowledge is applied and scaled.
Volume vs Wealth Concentration
Not all universities create wealth the same way. Some dominate in volume. Others dominate in wealth per individual. For example, Harvard University produces the most billionaires but ranks much lower in per capita wealth.
On the other hand, the University of Maryland produces fewer billionaires but leads in average wealth per person, at $34.34B.
The Rare Balance: Scale + Wealth
Only the University of Pennsylvania and Stanford University rank in the top 10 for both billionaire count and per capita wealth.
Pennsylvania ranks 3rd with 63 billionaires and 4th with $17.35B per capita, while Stanford ranks 2nd with 86 billionaires and 8th with $14.05B per capita.
This makes them the only institutions that successfully combine scale and high individual wealth, a rare and powerful position.
Conclusion:
When you step back and look across universities, subjects, and countries, a clear pattern starts to emerge.
Wealth at the highest level is not evenly distributed. It tends to follow systems that combine strong education with real-world opportunities, access to capital, and industries that can scale. This is why a small group of countries and institutions consistently produce a disproportionate share of billionaires.
But the deeper insight goes beyond rankings.
It is about alignment.
The most successful outcomes often come from being in the right environment, studying the right kind of problems, and being surrounded by systems that allow ideas to grow. Universities in places like the United States and China do not just provide education. They place students inside ecosystems where funding, talent, and markets already exist.
Subjects follow a similar pattern.
Fields like business, engineering, and computer science dominate because they are directly connected to scalable industries. At the same time, less direct paths like law, humanities, or arts still create opportunities, but often through influence, positioning, or by combining with other disciplines.
For students, this is where the real takeaway lies.
There is no single path. But there are clear patterns in where the odds are stronger.
In the end, billionaire wealth is shaped by three forces working together:
The university environment The economic system of the country The field of study and how it is applied
When these align, the probability of creating extreme wealth increases significantly.
This is what truly defines the global pipeline of billionaire creation.
Methodology
This study was conducted by HumanizeAI.co, analyzing the educational background of 3,184 billionaires from the Forbes billionaires list of March 2026.
The objective was to identify how universities, subjects of study, and geographic factors contribute to billionaire wealth creation using a structured, normalized dataset.
Data Sources:
Data Type
Source
Billionaire Data
Forbes Billionaires List 2026
University Information
Public profiles, official biographies
Subject of Study
LinkedIn, interviews, media coverage
Supporting Data
Verified online sources and news media
Note: Education data was identified for 78.91% of billionaires, while 21.09% remained unknown or unavailable.
Data Cleaning:
The raw dataset was collected from multiple sources and required careful standardization before analysis.
We removed duplicate billionaire entries using exact name matching to avoid double-counting. University names were normalized to ensure consistency, merging variations such as “MIT” and “Massachusetts Institute of Technology,” as well as degree-specific mentions.
Additionally, formatting inconsistencies across sources were corrected so that all entries followed a uniform structure. This step ensured that the dataset was clean, reliable, and comparable across all categories.
Calculations:
Metric
Description
Total Net Worth
Combined wealth of billionaire alumni for each university
Net Worth Per Capita
Average wealth per billionaire alumni
Country Aggregation
Grouped universities by country to analyze geographic dominance
Subject Distribution
Calculated the percentage share of each subject across 3,184 billionaires
Ranking Logic
Universities ranked based on total billionaire alumni count
Subject Normalization Framework:
To make the data consistent and comparable, all fields of study were grouped into broader standardized categories.
Normalized Subject
Sub-fields Included
Business & Economics
Business Administration, Economics, Finance, Accounting, Management, Marketing, Entrepreneurship, International Business, Operations, Commerce, Real Estate, Banking, Business Analytics, MBA
To ensure fairness and consistency in the analysis, several assumptions were applied.
Billionaires who attended multiple universities were counted across each institution they studied at, with equal weight assigned to each. This approach avoids bias toward a single institution but distributes influence across multiple universities.
Country attribution was based on the official location of the university rather than the nationality of the billionaire. Missing education data was grouped under “Unknown,” ensuring transparency in reporting.
All wealth figures were based on the latest available March 2026 estimates, providing a consistent reference point for comparison.
Limitations of the Study:
While this study offers solid information about billionaire education and wealth patterns, there are important limitations to consider.
A key limitation is multi-university attendance. Many billionaire alumni studied at more than one institution. Instead of assigning them to a single university, each institution received equal weight. As a result, the aggregated counts and percentages may not represent exact individual counts but rather an approximate distribution of educational influence.
Another limitation is data availability. Education data was only available for 78.91% of billionaires, while 21.09% remains unknown or unavailable. This means some patterns may shift slightly as more complete data becomes available.
There is also a limitation in subject classification. To make the dataset consistent, all fields of study were normalized into broader categories. While this improves clarity and comparability, it may oversimplify specialized or interdisciplinary fields.
Finally, wealth fluctuation must be considered. Billionaire net worth is dynamic and influenced by market conditions. All figures are based on March 2026 estimates, meaning rankings and averages may change over time.
Overall, the findings in this study should be interpreted as data-driven approximations of global trends, rather than exact absolute values.
A single AI system can reshape productivity, redirect global investment, influence national policy, and accelerate the adoption of technology worldwide. We have already seen how one transformative AI model can shift the competitive landscape almost overnight.
But breakthroughs do not happen in isolation.
Behind every industry-changing AI system are researchers, universities, funding ecosystems, infrastructure networks, regulatory environments, and public acceptance. Innovation requires talent, but sustainable AI leadership requires alignment.
When AI transforms industries, industries transform economies. And when economies shift, global power shifts with them.
This is why the AI Brain Race is no longer about who launches the next model. It is about which nations are structurally positioned to sustain future AI leadership.
To identify which countries are building the foundations of long-term AI leadership, we conducted a data-driven Global AI Brain Race study built on two core perspectives: AI Readiness and AI Education and Academic Depth.
AI Readiness
AI readiness measures whether a country has built the structural conditions required to convert AI innovation into national advantage.
It evaluates research intensity, economic integration, infrastructure capacity, talent depth, governance maturity, responsible AI development, and public acceptance.
In the AI Brain Race, leadership is not determined by research alone. It depends on whether innovation can move from laboratory breakthrough to industrial adoption to nationwide scale.
AI readiness reveals which countries are prepared to lead, and which are still assembling the pieces.
AI Education and Academic Depth
Sustained AI leadership begins with people.
This dimension evaluates the strength and depth of each country’s AI education pipeline, including the number of leading AI universities and the quality of their global academic performance.
Because countries that dominate the future of artificial intelligence will be those that continuously develop the next generation of AI researchers, engineers, and decision-makers.
Education determines whether a nation makes a single breakthrough or builds enduring AI leadership over decades.
Key Findings:
United States Leads the AI Brain Race: The United States ranks first with a final score of 82 out of 100, leading in AI R&D (19.15 out of 27.78), economic integration (22.22 out of 22.22), and infrastructure (16.21 out of 16.67).
China Secures the #2 Position: China ranks second with a final score of 59 out of 100, supported by the world’s largest AI education base with 107 top AI universities and strong R&D (17.22 out of 27.78).
China Leads in the Number of Universities for the AI Subject: China has over 4x as many top universities for AI subjects as the United States. While the U.S. ranks #1 overall, China has 107 top AI universities compared to 26 in the U.S.
Europe Lacks a Top-Tier AI Leader: Only one EU country appears in the top 10. Germany ranks #10 with a final score of 28 out of 100, far behind the U.S. (82) and China (59), highlighting Europe’s competitive gap in AI dominance.
Asia Concentrates Half of the Top 10: Asia dominates the upper tier of the AI Brain Race, with 50% of the top 10 countries, signaling a strong regional shift in future AI leadership.
The UK Lags Behind the AI Superpowers: While the UK ranks in the top five, its final score of 33 (out of 100) is less than half of the U.S. (82) and far behind China (59), underscoring the dominance of the two global AI superpowers.
Singapore Proves Quality Can Outperform Scale: Singapore ranks third with a score of 37 out of 100, despite having only 2 AI universities, due to exceptional academic quality with an average subject score of 90.50 and a global score of 82.00, combined with strong talent readiness (9.31 out of 16.67).
India Excels in Talent but Lags in Infrastructure: India ranks sixth with 32 out of 100, driven by strong talent (9.12 out of 16.67) but constrained by infrastructure (0.65 out of 16.67) and governance (0.11 out of 5.56).
A Clear Performance Gap After Rank 20: Final scores fall below 23 after rank 20, indicating many countries lack the combined academic depth, infrastructure, and governance strength required for sustained AI leadership.
List of Top 30+ Countries Shaping The Next Generation of AI Leaders
The table below presents the top 30+ countries ranked in the Global AI Brain Race 2026. Each country is evaluated using a weighted framework that measures AI research and development, economic integration, infrastructure readiness, governance, talent, responsible AI, and academic strength. The final score reflects how structurally prepared each nation is to lead the next generation of AI development.
List of Top 30+ Countries Shaping The Next Generation of AI Leaders
Comprehensive analysis of countries Shaping The Next Generation of AI Leaders
Map: Top 30+ Countries Shaping The Next Generation of AI Leaders
Below is the complete ranking of 30+ countries in the Global AI Brain Race 2026.
Each position reflects the overall AI leadership strength of a nation relative to other nations in the study. Higher-ranked countries demonstrate stronger structural readiness to compete in the global AI landscape, while lower-ranked nations are still developing critical components of their AI ecosystems.
This visualization gives you a clear global snapshot of where leadership is concentrated, where gaps are emerging, and how countries compare at a glance.
AI leadership is concentrated among a small group of nations, with a noticeable separation between the top tier and the rest. The highest-ranked countries stand out not just for individual strengths, but for overall competitiveness across multiple dimensions of AI development.
At the same time, many countries show promise but remain structurally behind the leaders. The gap between the top performers and the middle tier highlights how uneven the global AI race has become.
Next, we take a closer look at the Top 10 countries to understand what distinguishes them in this year’s rankings.
Deep Dive: Top 10 Countries Shaping The Next Generation of AI Leaders
1) United States
Rank: #1 | Final Score: 82
The United States ranks number 1 with a final score of 82 out of 100, making it the most structurally prepared country in the Global AI Brain Race. This score reflects overall dominance across both national AI readiness and academic strength. In simple terms, the U.S. is not leading because of one advantage. It leads because its research, economy, infrastructure, governance, talent, and universities are aligned at scale.
AI Readiness
The United States shows the strongest AI environment in the study.
It records 19.15 out of 27.78 in AI R&D, the highest research strength among all countries. It also achieves the maximum 22.22 out of 22.22 in the Economy Index, showing deep integration of AI into economic activity.
Infrastructure is another major advantage, with 16.21 out of 16.67, indicating strong compute and deployment capacity. On governance and institutional maturity, the U.S. scores 4.22 out of 5.56 in Policy and Governance and a full 5.56 out of 5.56 in Responsible AI, demonstrating stronger regulatory alignment and responsible AI engagement than most competitors.
These scores confirm that the U.S. has the most complete AI readiness framework in the ranking.
AI Education and Academic Depth
Education further strengthens this position.
The United States has 26 top universities offering AI subjects, creating broad institutional depth. It records an average AI subject score of 55.85 out of 100 and a strong average global university score of 77.42 out of 100, reflecting globally competitive academic quality.
This ensures a continuous pipeline of AI leaders emerging from high-performing institutions within a mature national ecosystem.
Key Highlight: The United States is the only country that leads simultaneously in AI R&D, economic integration, infrastructure, and responsible AI, making it the most balanced and dominant AI ecosystem in the study.
2) China
Rank: #2 | Final Score: 59
China ranks second with a final score of 59 out of 100, making it the largest-scale AI ecosystem in the study. Its position reflects massive research output, expanding infrastructure, and the deepest academic AI pipeline globally. However, institutional balance remains weaker compared to the top-ranked country.
AI Readiness
China records 17.22 out of 27.78 in the R&D Index (AI), the second-highest score in the ranking, confirming its global research strength. Its Infrastructure Index score of 6.40 out of 16.67 supports rapid deployment of AI technologies across industry and state systems.
However, institutional indicators are significantly lower. China scores 2.23 out of 5.56 in the Responsible AI Index and 0.25 out of 5.56 in the Policy and Governance Index, which reduces regulatory balance and long-term systemic stability compared to the United States.
AI Education and Academic Depth
China’s most dominant advantage is scale in education.
China has 107 universities in the Total Number of Top Universities for the AI Subjects, compared to 26 in the United States. This means China has more than 4 times the AI university base of the top-ranked country.
In quality terms, China achieves an Average Subject Score of 54.52 out of 100 and an Average Global Score of 54.06 out of 100, indicating solid academic performance driven primarily by institutional volume rather than concentrated elite quality.
Key Highlight: China has 107 top AI universities, more than 4x the U.S. total, but weaker governance (0.25 out of 5.56) limits its overall dominance.
3) Singapore
Rank: #3 | Final Score: 37
Singapore ranks third with a final score of 37 out of 100, proving that scale is not the only path to future AI dominance. Despite its small size, Singapore performs strongly because of efficiency, institutional alignment, and exceptional academic quality.
AI Readiness
Singapore shows a strong workforce and governance alignment relative to its size.
It records 9.31 out of 16.67 in the Talent Index, one of the highest talent readiness scores in the ranking. This reflects strong AI skill penetration and hiring momentum.
Its Infrastructure Index score of 2.53 out of 16.67 is modest compared to larger economies, but within a compact national system, it remains deployment-ready. Singapore also scores 0.56 out of 5.56 in the Policy and Governance Index and 0.32 out of 5.56 in the Responsible AI Index, showing structured but measured institutional development.
AI Education and Academic Depth
Singapore’s biggest advantage lies in academic quality, not volume.
Singapore has 2 universities in the total number of top universities for AI subjects, a small institutional base compared to larger countries.
However, it achieves the highest Average Subject Score in the study at 90.50 out of 100, along with a strong Average Global Score of 82.00 out of 100.
This shows a highly concentrated, elite AI education system producing top-tier global scores despite limited institutional scale.
Key Highlight: Singapore has only 2 top AI universities, but the highest average subject score in the study (90.50 out of 100), demonstrating quality over scale.
4) South Korea
Rank: #4 | Final Score: 35
South Korea ranks fourth with a final score of 35 out of 100, reflecting a strong applied AI environment supported by infrastructure strength, public acceptance, and a competitive academic base. Its position shows a country focused on execution and deployment rather than sheer scale.
AI Readiness
South Korea records 4.96 out of 16.67 in the Talent Index, reflecting a solid and growing AI workforce. Its Infrastructure Index score of 4.23 out of 16.67 is one of the strongest infrastructure performances in the top ten, supporting real-world AI deployment.
Public adoption is also notable, with 3.59 out of 5.56 in the Public Opinion Index, one of the highest societal readiness scores among leading countries.
On governance, South Korea records 1.80 out of 5.56 in the Policy and Governance Index and 0.12 out of 5.56 in the Responsible AI Index, indicating institutional development is progressing but not yet fully mature.
AI Education and Academic Depth
South Korea has 8 universities in the total number of top universities for the AI Subject, providing a meaningful academic foundation.
It achieves an average subject score of 69.82 out of 100 and an average global score of 74.22 out of 100, reflecting strong academic competitiveness and global standing.
This combination of infrastructure readiness and steady academic performance supports sustained AI growth.
Key Highlight: South Korea combines strong infrastructure (4.23 out of 16.67) and high public readiness (3.59 out of 5.56) with 8 top AI universities, positioning it as a deployment-focused AI leader.
5) United Kingdom
Rank: #5 | Final Score: 33
The United Kingdom ranks fifth with a final score of 33 out of 100, reflecting a balanced and institutionally aligned AI ecosystem. While it performs steadily across governance, research, and education, it operates at a significantly smaller scale compared to the two global AI superpowers.
AI Readiness
The UK records 5.48 out of 16.67 in the Talent Index, indicating a competitive AI workforce.
It scores 2.63 out of 16.67 in the Infrastructure Index, showing moderate deployment capacity. In governance, it performs relatively strongly with 2.53 out of 5.56 in the Policy and Governance Index, one of the better governance scores in the top ten. It also records 0.56 out of 5.56 in the Responsible AI Index, reflecting early responsible AI engagement.
Overall, the UK demonstrates balance rather than dominance across readiness indicators.
AI Education and Academic Depth
The United Kingdom has 15 universities in the total number of top universities for AI Subject, giving it one of the strongest academic presences in the top five.
It achieves an average subject score of 55.00 out of 100 and an average global score of 71.17 out of 100, reflecting strong international academic standing.
Key Highlight: Despite ranking #5, the UK’s final score of 33 is less than half of the U.S. (82) and far behind China (59), underscoring the scale gap between the UK and the two global AI leaders
6) India
Rank: #6 | Final Score: 32
India ranks sixth with a final score of 32 out of 100, driven primarily by its strong and expanding AI talent base. While it demonstrates significant workforce strength and research momentum, gaps in infrastructure and governance limit its ability to compete at the scale of the top-ranked countries.
AI Readiness
India records 9.12 out of 16.67 in the Talent Index, one of the highest talent scores in the ranking. This reflects strong AI skill penetration and workforce growth.
However, infrastructure remains a constraint, with just 0.65 out of 16.67 in the Infrastructure Index, indicating limited large-scale deployment capacity. Governance indicators are also low, with 0.11 out of 5.56 in the Policy and Governance Index and 0.35 out of 5.56 in the Responsible AI Index, showing institutional frameworks are still developing.
This creates a gap between human capital strength and national AI readiness.
AI Education and Academic Depth
India has 6 universities in the total number of top universities for the AI subject, showing a growing but still limited academic AI base relative to the leading countries.
It achieves an Average Subject Score of 39.52 out of 100 and an Average Global Score of 40.45 out of 100, reflecting a maturing AI education ecosystem that is still scaling in quality and global competitiveness.
Key Highlight: India’s strong talent score (9.12 out of 16.67) drives its ranking, but weak infrastructure (0.65 out of 16.67) and governance (0.11 out of 5.56) limit its ability to match the top five.
7) Switzerland
Rank: #7 | Final Score: 31
Switzerland ranks seventh with a final score of 31 out of 100, reflecting strong research quality and academic efficiency despite operating at a smaller national scale. Its position shows that concentrated excellence can compete with larger AI economies.
AI Readiness
Switzerland records 7.63 out of 16.67 in the Talent Index, indicating a strong and specialized AI workforce relative to its size. It also achieves 4.19 out of 16.67 in the Infrastructure Index, supporting steady research-to-application translation.
Its governance and responsible AI scores remain modest, with 0.23 out of 5.56 in the Policy and Governance Index and 0.23 out of 5.56 in the Responsible AI Index, suggesting that institutional expansion has room to grow.
Overall, Switzerland’s readiness profile reflects quality and stability rather than scale-driven expansion.
AI Education and Academic Depth
Switzerland has 2 universities in the Total Number of Top Universities for the AI Subject, a small but highly competitive academic base.
However, it achieves an Average Subject Score of 65.25 out of 100 and an impressive Average Global Score of 75.40 out of 100, placing its universities among the strongest academically in the ranking.
This highlights a highly concentrated, research-intensive education ecosystem.
It achieves an Average Subject Score of 39.52 out of 100 and an Average Global Score of 40.45 out of 100, reflecting a maturing AI education ecosystem that is still scaling in quality and global competitiveness.
Key Highlight: With just 2 top AI universities, Switzerland achieves a high Average Global Score (75.40 out of 100), demonstrating academic quality over volume.
8) Canada
Rank: #8 | Final Score: 30
Canada ranks eighth with a final score of 30 out of 100, reflecting a strong research-driven AI ecosystem supported by academic credibility and workforce stability. While it does not operate at the scale of the top-ranked countries, it maintains consistent performance across key indicators.
AI Readiness
Canada records 7.94 out of 16.67 in the Talent Index, highlighting a competitive AI workforce. It also achieves 3.19 out of 16.67 in the Infrastructure Index, supporting steady AI deployment capacity.
In governance, Canada records 0.35 out of 5.56 in the Policy and Governance Index and 0.46 out of 5.56 in the Responsible AI Index, indicating cautious but structured institutional development.
Overall, Canada demonstrates stability and research alignment rather than rapid expansion.
AI Education and Academic Depth
Canada has 6 universities in the total number of top universities for the AI subject, providing steady institutional depth.
It achieves an average subject score of 52.90 out of 100 and an average global score of 67.07 out of 100, reflecting internationally recognized academic quality.
Key Highlight: Canada combines a strong Talent Index score (7.94 out of 16.67) with 6 top AI universities, reinforcing its research-driven AI foundation.
9) Japan
Rank: #9 | Final Score: 29
Japan ranks ninth with a final score of 29 out of 100, reflecting strong infrastructure and applied AI capability, particularly in industrial and robotics-driven sectors. While its academic scale in AI is limited, its deployment capacity remains one of the strongest in the top ten.
AI Readiness
Japan records 5.70 out of 16.67 in the Talent Index, indicating steady workforce strength.
Its biggest advantage is infrastructure, with 5.51 out of 16.67 in the Infrastructure Index, one of the highest infrastructure scores among the top-ranked countries. This supports real-world AI deployment across manufacturing and advanced automation.
However, governance indicators remain modest, with 0.21 out of 5.56 in the Policy and Governance Index and 0.30 out of 5.56 in the Responsible AI Index, suggesting limited institutional expansion in AI regulation and responsible AI research.
AI Education and Academic Depth
Japan has 1 university in the total number of top universities for AI subjects, indicating a limited AI-specific academic scale.
It achieves an Average Subject Score of 46.10 out of 100 and a strong Average Global Score of 72.20 out of 100, reflecting solid global academic standing despite low AI program concentration.
Key Highlight: Japan stands out in infrastructure (5.51 out of 16.67) but has only 1 top AI university, showing strength in deployment rather than academic scale.
10) Germany
Rank: #10 | Final Score: 28
Germany ranks 10th with a final score of 28 out of 100, making it the only European Union country in the top ten. Its position reflects strong engineering foundations and applied AI capability, particularly across industrial and manufacturing systems. However, its overall scale remains significantly smaller than the top-ranked global leaders.
AI Readiness
Germany records 5.76 out of 16.67 in the Talent Index, showing steady workforce readiness. It achieves 3.00 out of 16.67 in the Infrastructure Index, indicating reliable but not dominant deployment capacity.
On governance, Germany scores 0.52 out of 5.56 in the Policy and Governance Index and 0.66 out of 5.56 in the Responsible AI Index, reflecting gradual institutional development in AI regulation and responsible AI engagement.
Overall, Germany demonstrates structural stability but lacks the scale of higher-ranked countries.
AI Education and Academic Depth
Germany has 1 university in the total number of top universities for the AI subject, indicating limited AI-specific academic volume compared to other top ten countries.
However, it achieves a strong Average Subject Score of 65.90 out of 100 and an Average Global Score of 72.50 out of 100, showing solid academic quality despite limited institutional scale.
Germany’s AI competitiveness is driven more by applied engineering strength than by broad academic expansion.
Key Highlight: Germany is the only EU country in the top 10 (Final Score: 28 out of 100), supported by strong academic quality (Average Subject Score: 65.90 out of 100) but limited institutional scale (1 top AI university).
Conclusion
The Global AI Brain Race shows that future AI dominance in AI leadership is not driven by a single factor, such as research output, talent size, or university count. Instead, countries that rank highest are those that successfully align education, talent, infrastructure, policy, and real-world adoption into a cohesive national system.
The United States leads because it performs strongly across every major dimension, combining research scale, economic integration, infrastructure readiness, governance, and academic depth. China follows through with unmatched scale and execution, but a weaker institutional balance limits its ability to overtake the top position. Singapore demonstrates that efficiency and academic quality can rival scale, while countries like South Korea, the United Kingdom, and Canada show the importance of stability and applied AI readiness.
At the same time, the rankings highlight a clear divide between countries positioned for long-term AI leadership and those with emerging capability. High talent availability or strong research alone is not enough without supporting infrastructure, governance, and education systems that can sustain progress over time.
Overall, the data makes one conclusion clear. Countries best positioned for future AI dominance are those that invest not only in technology but also in the people, institutions, and environments required to develop the next generation of AI leaders consistently.
Methodology of Our Study
How We Ranked Countries Shaping the Next Generation of AI Leaders
The objective of this study was to develop a transparent, data-driven ranking of countries positioned for sustained AI leadership.
To achieve this, we built a blended composite scoring framework evaluating two foundational pillars:
National AI Ecosystem Strength & Readiness
Academic Leadership Capacity & Depth of AI Education
The first pillar measures how structurally prepared a country is to compete in artificial intelligence today. It captures national research intensity, economic AI integration, infrastructure capacity, governance maturity, public engagement, and responsible AI development.
The second pillar evaluates long-term AI leadership potential by assessing the strength, depth, and global competitiveness of AI-focused higher education institutions.
All indicators were normalized and weighted to generate a final composite score out of 100 for each country.
Scoring Framework:
Maximum Point Allocation
Each country was evaluated using a structured composite model with a maximum attainable score of 100 points, distributed across seven core ecosystem indicators:
Indicator
Maximum Points
AI Research & Development (R&D) Index
27.78
AI Economy Index
22.22
AI Talent Index
16.67
AI Infrastructure Index
16.67
Responsible AI Index
5.56
Policy & Governance Index
5.56
Public Opinion Index
5.56
Total Maximum Score
100
A country’s final score reflects its cumulative performance relative to this 100-point benchmark.
Weighting Structure:
The final score combines ecosystem and academic indicators using the following weighting model:
National AI Ecosystem Strength & Readiness (65%)
Indicator
Weight
R&D Index (AI)
15%
Economy Index
15%
Infrastructure Index
10%
Talent Index
10%
Responsible AI Index
5%
Policy & Governance Index
5%
Public Opinion Index
5%
These indicators measure the vibrancy and structural maturity of a country’s AI environment.
Academic Leadership Capacity & Depth of AI Education (35%)
Indicator
Weight
Total Number of Top Universities for AI Subjects
15%
Average AI Subject Score (out of 100)
10%
Average Global University Score (out of 100)
10%
These indicators evaluate institutional depth, academic quality, and the ability to produce future AI leaders.
Data Sources:
Stanford AI Index Report: National AI activity, research, economic integration, infrastructure, governance, public sentiment, and responsible AI indicators.
U.S. News Education Rankings: AI subject rankings and university counts.
Global University Ranking Systems: Overall academic quality and global institutional standing.
Final Scoring Process:
Each indicator was normalized to ensure cross-country comparability.
Normalized values were multiplied by assigned weights and aggregated to produce a Final Composite Score (0–100).
All rankings are strictly data-based and reflect measurable structural readiness for sustained AI leadership.
Why This Blended Model Matters:
This methodology prevents bias toward scale or education alone.
Countries with strong AI activity but weak academic depth are not overrated. Countries with strong universities but limited ecosystem maturity are not overranked.
The highest-ranked nations are those where research, economy, infrastructure, governance, public readiness, and education reinforce one another.
The result is a ranking that identifies not only today’s AI leaders but also the countries best positioned to sustain and dominate AI leadership in the years ahead.